Please click here to download full forecast as a PDF.
Bahamas Season Fishing Forecast for 2018:
FISHING ACTION IN THE BAHAMAS IS HEATING UP
By Daniel C. Westhaver
Introduction:
Since 2003 the oceanographers at ROFFS™ have been developing objective methods for forecasting the overall fishing conditions during the spring Bahamas tournaments from April through early June. The hypothesis for forecasting the seasonal marlin fishing action stems from the location of the bluer and often warmer water that occurs from the Cat Island – San Salvador Island area and south to southeast of these islands where it is presumed that the marlin concentrate before, during, and after spawning. We have been calling this water “blue marlin water” in our analyses for some time now. From satellite data, it is relatively easy to identify this water based on its optical signature and surface water temperature characteristics. Our working hypothesis and experience have shown that the marlin are associated with this water and the more “blue marlin water” that exists in the Abaco Islands and Eleuthera Island areas, the greater the relative apparent abundance of marlin in these areas.
In recent years we have also observed an association between the “blue marlin water” and the yellowfin tuna action in the Bahamas, and where it extends northward along the western side of the Gulf Stream between Jacksonville, Florida and towards Cape Hatteras, North Carolina. We do observe evidence that when more of this “blue marlin water” passes northwest of Abaco to the eastern side of the Gulf Stream that a certain unknown proportion of the migratory fish move to the western side of the Gulf Stream. This brings more fish to the coastal fisheries at the edges of the Gulf Stream water throughout the season.
The same is also true for the canyon areas in the northeast offshore of New Jersey, New York and Massachusetts when the blue water is brought to the edge of the continental shelf (100 fathoms/600 feet) starting in March or April by Gulf Stream eddy features. Stay tuned to ROFFS™ for the next few weeks and into April for additional discussion related to marlin, yellowfin tuna and bigeye tuna and oceanographic conditions and seasonal fishing forecasting off the United States east coast and in the Gulf of Mexico area.
Based on our observations of the fishing action and ocean conditions in the Bahamas from Eleuthera to the Abacos over the last 20+ years, it appears that excellent fishing action occurs within the Bahamas tournament areas when there is a substantial volume of the “blue marlin water” pushing over the 100 fathom (600 feet) and shallower ledges along the eastern side of Eleuthera and the Abacos. Relatively favorable fishing seasons occur when this water only occurs over the 500-1000 fathom depths, but does not reach the 100 fathom or shallower depths of both areas. Mediocre years occur when there is a lack of this water over these areas. Short pulses of this water bring fish into the area along with pulses of fishing action. However, unless the flow is persistent, the catch rates remain average to below average over the longer term through the season.
It is also important to understand that good fishing action on a daily basis is linked to the favorable direction of flow of these currents and when the water mass boundaries of these currents are stable for consecutive days over good bottom topography. These features that have remained favorable for multiple days normally concentrate the baitfish drawing bigger fish into these areas. Our experience and research shows that in the Bahamas offshore areas the dissolved oxygen concentration does not appear to be a major factor at the present time compared with the temperature and clarity of the water. In other areas to the south, the dissolved oxygen has a greater controlling factor on fish distribution both vertically and horizontally.
The working hypothesis is also based on our experience using the hourly satellite observations of the ocean conditions derived by Roffer’s Ocean Fishing Forecasting Service, Inc. – ROFFS™ (roffs.com) and catch reports provided by a variety of sources for the past 30 years. The infrared (IR) satellite data are used to observe the sea surface temperature (SST) and the ocean color data are used for indices of phytoplankton (chlorophyll), water clarity, and colorized dissolved organic material are received from a variety of data sources including NASA, NOAA, Suomi National Polar-orbiting Partnership (SNPP or JPSS), and the European Space Agency (ESA) satellites.
ROFFS™ also uses data derived from other sources of data such as drifting buoys, gliders, aircraft, private boats, and satellite altimeters. The altimeter data only provides a coarse spatial and temporal resolution with a time delay (5-10 days to produce usable large scale circulation models) that limits the data’s utility related to high resolution and real-time operational oceanography. While the ocean changes significantly over such short periods, the altimeter data can be used for an overall, view of the ocean’s surface circulation. It is not typically useful for evaluating small scale, short-term (daily and sub-daily) changes in the ocean currents or their boundaries that control the location of the fish.
During the last several years we had observed that the conditions over the Bahamas tournament areas were particularly favorable as early as January, February and March in terms of the presence of “blue marlin water” off Abaco and Eleuthera as exemplified by 2012 conditions (Figures 1 & 2). As stated earlier, the critical aspect for having a good blue marlin season is the presence of the “blue marlin” water pushing over the 100 fathom (~ 600ft) ledge or the bank and good bottom structure and canyon areas creating persistent convergence zones for baitfish to concentrate.
Figures 1 and 2 show the distribution of the “blue marlin water” prior to the 2012 Bahamas spring tournament season. Figure 1 was derived over the March 03-06, 2012 period using a variety of IR satellite data from NOAA, NASA, and ESA that shows the water masses based on their signature SST. Figure 2 is an ocean color image that was derived from NASA and ESA satellites over March 01-03, 2012 that shows the water masses based on their signature ocean color and chlorophyll content. Clouds prevented us from providing an exact match in time due to the clouds associated with the strong cold front that stalled over the Bahamas during this time period, as the satellites cannot observe the ocean conditions through the clouds. However, using a variety of computer techniques ROFFS™ was able to remove cloud artifacts to allow a one-day overlap of the imagery and provide a better comparison. The darker blue water is the “blue marlin water”.
[responsive]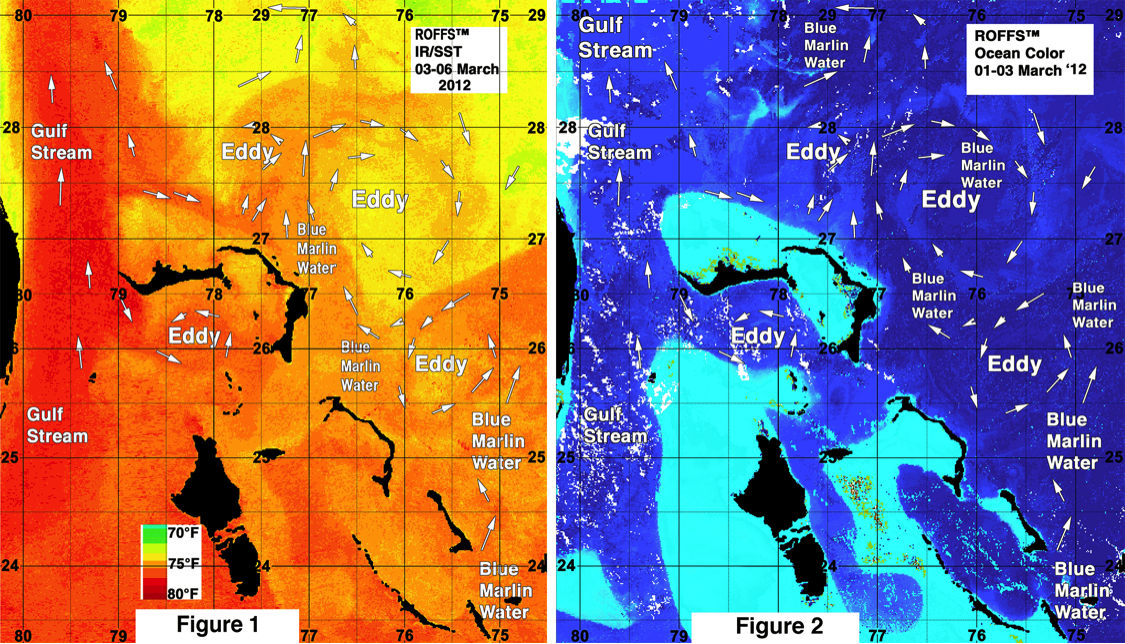 [/responsive]
Figure 1: shows an infrared (IR) derived sea surface temperature (SST) image derived using NOAA and NASA imagery over the 03-06 March 2012 period. Figure 2: shows an ocean color image derived over 01-03 March 2012 using NASA imagery. Arrows point the direction of currents. Important features are labeled.
During the actual 2011 through 2016 Bahamas tournament fishing seasons the “blue marlin water” existed in the tournament areas, only to be pulled away from the tournament area by the ocean currents forced by various eddy features (60-120 miles in diameter) that occurred east and northeast of Abaco. Some good fishing action happened during these years due to the intermittent arrival of the “blue marlin water” and the presumed migration of the fish through the area. However, during tournament times in April, May and June most of this “blue marlin” water was pulled north and northeast, as has been the trend over the past five to six years prior to 2017. There was a brief good pulse of warmer “blue marlin water” directly into east Abaco and into the Abaco Canyon areas between May 15th and May 25th of 2016 that produced some good fishing conditions during that time but that water was short lived. However, last year (2017), we showed the arrival of the “blue marlin” water east of Abaco almost to the 100-500 fathom contours and north of Walker’s Cay by mid-March (Figure 3 and 4). This larger amount of “blue marlin water” located farther to the northwest and north of Abaco, and the west to northwest push of this warmer darker “blue marlin water” continued to drift toward the Gulf Stream, which resulted in an earlier than normal pulse of marlin and tuna to the northern Bahamas areas. This also resulted in an earlier than normal influx of marlin, tuna and wahoo migration north within the Gulf Stream and east coast United States areas. In April and May 2017, “blue marlin water” was held into the ledges from between Eleuthera and Abaco by consecutive clockwise rotating eddy features east of Cat Island and Eleuthera providing good marlin and tuna action for the majority of the season. We do not know if a circulation regime shift in the region is occurring, but only time will tell. Our experience suggests that variability is normal, but this is something that a long-term altimeter study could resolve.
[one_half][responsive]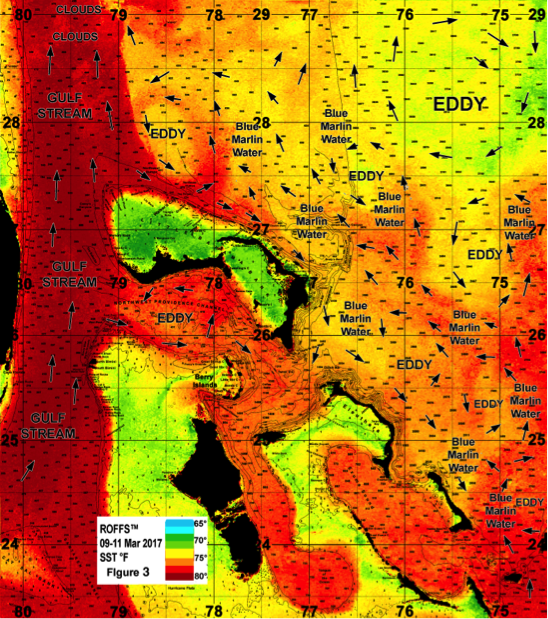 [/responsive][/one_half] [one_half_last][responsive]
 [/responsive][/one_half_last]
Figure 3: Last years conditions were derived from a variety of infrared sensors to get SST from NASA, NOAA, and JPSS satellites during March 09-11, 2017 and Figure 4: was derived from the ocean color/chlorophyll imagery during March 09-11, 2017 from the VIIRS sensors on SNPP satellite in combination with the Aqua sensor on the MODIS satellite respectively. We consider this an image pair.
Background and Some Data for 2018
Although we have learned that the oceanographic conditions develop from the presence, absence or mixture of the “blue marlin water” during the main tournament season, we continue the tradition of preparing the annual forecast from the beginning of March. This allows us to gain insight into the conditions prior to the tournament season and understand the ongoing fishing success starting in March. One of the challenges of producing such an early forecast is that these fishing events extend over a relatively long time period from April through the end of June. Conditions are likely to change significantly from one fishing event to the next without any scientifically proven and field-tested methods to predict the changes over the period from March through June. Despite what you may be reading in non-scientific media sources, there still are no reliable numerical oceanographic models that make accurate and reliable high resolution localized oceanographic forecasts for long-term fish finding applications. ROFFS™ continues to work with other oceanographers to improve, test and validate ocean and climate models, so perhaps in the future our task for the seasonal forecast will be easier.
For forecasting short-term oceanographic conditions related to finding fish, ROFFS™ believes that the conditions observed on any given day are the ones likely to continue into the short-term future (24-48 hours) unless we can see any currents or eddies that would drive the changes over a longer period of time. This is known as the “climatology and persistence” technique of forecasting. While getting larger scale interpretations of conditions using altimeter or models, we prefer to use real-time direct observations and have learned that evaluating the preseason conditions annually provides insight into future seasonal trends. Experience is our greatest asset, and as we have had success in forecasting seasonal trends of fishing productivity based on the location, condition, and likely future changes of the fishes’ preferred habitat in time and space for a variety of species spanning many areas of the world.
For the spring Bahamas tournament season we derive our first indications of the ocean conditions during the first two weeks in March. We evaluate whether or not we are observing “normal” (climatologically mean conditions) or anomalies. We rely on real time satellite data but use climate models from some of the world experts in the field. One indication is sea surface temperature (SST) in the core of the Gulf Stream off Miami and the SST of the Bahamas blue marlin water east of Cat Island to east of Long Island. Because we started our forecasting studies during the first week of March in 2003 we have continued our time series using that week to directly compare each year.
The ROFFS™ 15 year (2003-2017) mean SST for the core of the Gulf Stream off Miami is 78.5°F during our standard early to mid-March measurement period. The SST has been as low as 74.8°F (2009) to a high of 80.5°F (2007) and still have not observed any overall trends as of yet, unlike other areas such as the Gulf of Maine (increasing). Climate variability and change is not evenly distributed. This year the SST was 79.6°F in the core of the Gulf Stream off of Miami on March 08-11 (2018), which is lower by almost a degree from last year, but is still warmer than the 15-year mean. While we have not been recording the SST of the Bahamas “blue marlin” water offshore of Cat Island to Long Island as long, the ten year mean (2008 – 2017) SST for the warmer water east of Cat Island area is 76.8°F. This year the SST of the “blue marlin” water east of Cat Island/Long Island was 78.4°F (very similar to last year (78.1°F) during the standard early to mid-March time period. The water off Cat Island warmed slightly while the water within the Gulf Stream cooled compared to last year. Although the warmer weather in the tropics is likely to explain the slight increase in the temperatures off Cat Island, the multiple atmospheric cold fronts and associated higher winds along with the higher than normal northeastern storms are likely to be a contributing factor in the cooler temperatures within the Gulf Stream. Although we continue to observe this variability and no real consistent trends, the presence of the warmer water and “blue marlin water” off Cat Island could again indicate an earlier than normal arrival of marlin and various tuna species into the Bahamas region and farther north. While we are receiving reports of sailfish, mahi and cobia off southeast Florida, and wahoo action from Jacksonville north to off Morehead City, NC and Cape Lookout, NC, we have also received reports of blue marlin and good yellowfin tuna action earlier this month off Abaco, Eleuthera, north of Berry Islands and Cat Island.
The global, hemispheric and especially the regional climate models provide guidance into the present and future conditions. We usually use the oceanographic models, climate data, analyses, and forecasts provided by Columbia University’s International Research Institute (IRI) for Climate and Society (https://iri.columbia.edu), NOAA’s Climate Prediction website (http://www.cpc.ncep.noaa.gov), the National Center for Atmospheric Research (NCAR https://climatedataguide.ucar.edu/about), as well as sage advice from our colleagues at NOAA’s Atlantic Oceanographic and Meteorological Laboratory (AOML http://www.aoml.noaa.gov/), the University of Miami’s Cooperative Institute for Marine and Atmospheric Studies (CIMAS http://cimas.rsmas.miami.edu/) and North Carolina State University (http://omgsrv1.meas.ncsu.edu:8080/CNAPS/atm.jsp). We also use catch data from a variety of public and private sources. Based on the 2018 IRI multi-model probability forecast, the precipitation is expected to be slightly below the climatological mean or “normal” conditions over the April-May-June period. As what happened in 2017, air temperatures are likely to be normal to slightly above normal, but leaning toward cooler temperatures during April through June and leaning towards warmer temperatures from July though September and SST is forecasted to be slightly below the mean in the Bahamas Islands area. This suggests that although the “blue marlin water” is already producing fish this season, the main population of marlin is not likely to arrive earlier than normal due to the slightly lower water temperatures compared to the same time last year, and the likely arrival of marlin to the northern Bahamas area will occur at normal seasonal times along with the influx of the warmer “blue marlin water”.
As we continue to monitor and learn more about air – sea interaction, climate variability and ocean-wide circulation we started to consider other indices a few years ago such as the North Atlantic Oscillation (NAO) and the Atlantic Multidecadal Oscillation (AMO). Without going into detail the NAO is the dominant mode of winter climate variability in the North Atlantic region ranging from central North America to Europe and much into Northern Asia. The NAO is a large-scale variation in atmospheric mass between the subtropical high and the polar low. The corresponding index varies from year to year, but also exhibits a tendency to remain in one phase for intervals lasting several years. The NAO is a climatic phenomenon in the North Atlantic Ocean defined as the difference of atmospheric pressure at sea level between the Icelandic low and the Azores high. Through east-west oscillation motions of the Icelandic low and the Azores high, it controls the strength and direction of westerly winds, currents, and storm tracks across the North Atlantic Ocean. It is part of the Arctic oscillation, and varies over time with no particular periodicity. It appears to be one of the most important manifestations of climate fluctuations in the North Atlantic and surrounding humid climates (see Wikipedia and the previously listed web links for more details). The NAO 2017 index for January and February 2017 was 0.48 and 1.00 respectively, normal to above normal. This year (2018) the NAO index for January and February is 1.44 and 1.58 respectively, which is slightly increased compared to last year. We continue to remain uncertain what the implications are for water current velocity (speed and direction), ocean eddy generation and movements, as the effects of NAO in the Bahamas area is not obvious. Typically the NAO is more important for driving the west to east winds (westerly’s) north of 30°N latitude (mostly 45°-65°N). An increase in the NAO means that the Icelandic low gets lower and the Azores high gets higher creating a stronger atmospheric gradient between the two which results in stronger winds from the west that essentially acts to cool the North Atlantic Ocean overall. A decrease in NAO index suggests less wind and warming. To understand the significance to the trends in the North Atlantic Ocean SST one has to consider the entire year, as well as, several years and decades of data. This is beyond the scope of this article.
The Atlantic Multi-decadal Oscillation (AMO) has been identified by some as a coherent mode of natural variability occurring in the North Atlantic Ocean with an estimated period of 60-80 years. It is based upon the average anomalies of sea surface temperatures (SST) in the North Atlantic basin, typically over 0°- 80°N latitude. (https://climatedataguide.ucar.edu/climate-data/atlantic-multi-decadal-oscillation-amo). The unsmoothed AMO Index for January and February 2016 was 0.238 and 0.163 respectively. In 2017 the January and February values were 0.233 and 0.234 and in 2018 they were 0.173 and 0.063 respectively.
We have learned that the positive trend in these indices suggest a slowdown of the North Atlantic Ocean Circulation is occurring. This includes a slowing of the Gulf Stream system. The exact rate of slowing is unknown and the impact on Gulf Stream intrusion into the Gulf of Mexico (Loop Current), as well as, the resulting meanders and eddy formation is yet to be shown, although we have already observed some changes. Also a positive AMO is usually associated with an increase in the number of tropical storms that mature into hurricanes because the overall North Atlantic Ocean SST is higher (i.e., higher anomalies). This does not take into account the wind shear variability and other aspects of tropical storm genesis. For easy to understand answers to frequently asked questions about the AMO see http://www.aoml.noaa.gov/phod/amo_faq.php#faq_2.
Regarding El Niño we have yet to see or read about any direct relationship between El Niño – La Niña and the Southern Oscillation (ENSO) and the oceanographic conditions in the Bahamas area. Currently we are in a weak La Niña phase and transitioning to a “normal or neutral” ENSO conditions during the March to May 2018 season (https://iri.columbia.edu/our-expertise/climate/forecasts/enso/current/). However, we continue to monitor the conditions closely. We will continue to investigate the relationship between the North Atlantic Ocean climate and the oceanographic conditions in the Bahamas in the future. But we included this information to spark your interest in climate indices.
Nowcast Analysis
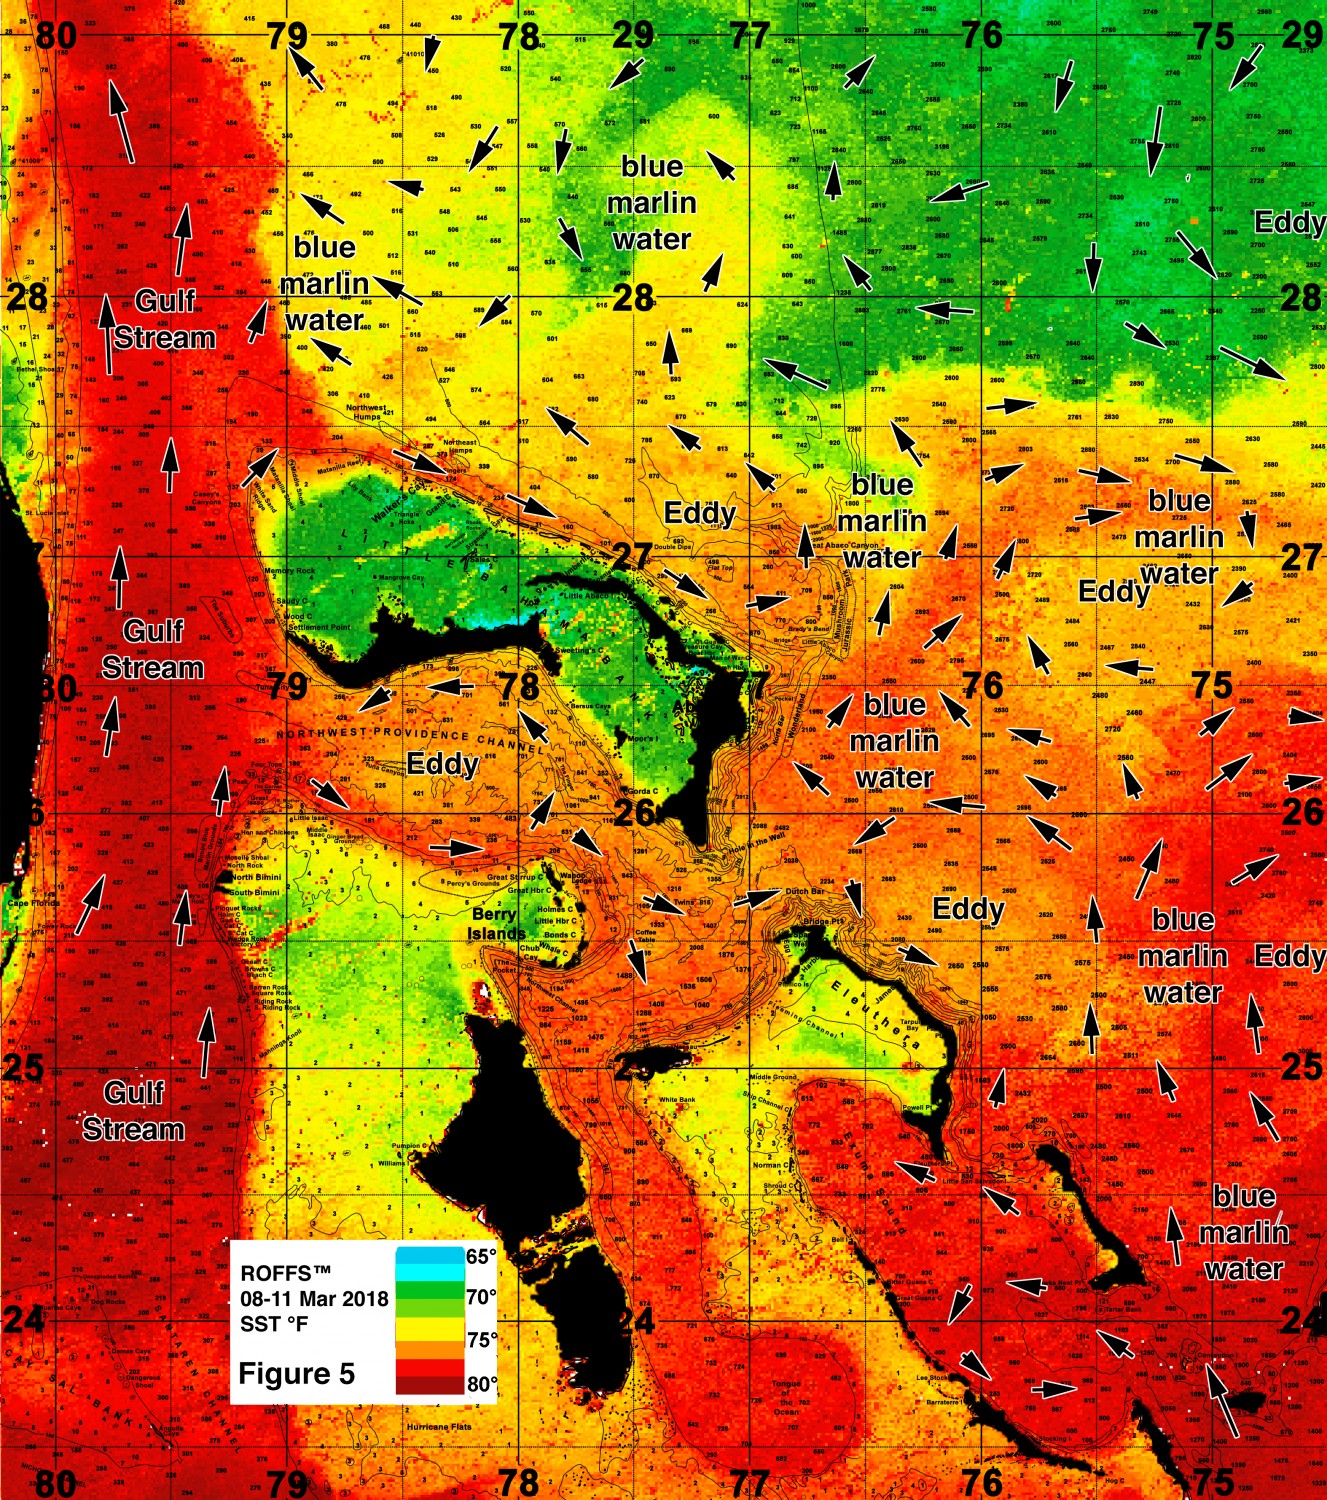
In this section we want to discuss and show you the current oceanographic conditions (Figure 5 and Figure 6) and compare it briefly to last years conditions (Figure 3 and 4). For clarification purposes Figures 3 and 5 were derived from a variety of U.S. (NASA, NOAA, JPSS) satellites during the early to mid-March (March 09-11) period and Figures 4 and 6 were derived from the U.S. SNPP VIIRS and NASA MODIS Aqua ocean color/chlorophyll imagery during relatively same early to mid-March time period (March 08-16). The exact values of the original data from different satellite sensors are not the same but we cross-calibrated the imagery so that the signature and values of the blue marlin water is consistent over the histories of the satellites.
In both instances, we could not use single and same day imagery for the SST and ocean color data due to cloud cover interference, so we used a combination of imagery and the ROFFS™ cloud reduction techniques to produce these relatively cloud-free images. However, for comparison purposes we consider these images as an equal image pair for the purposes of this discussion. Also, it is important to note, that the exact same color pallets were not used from year to year (look at the color bar for reference for the SST images), but we did evaluate in more detail the overall regional SST differences manually between 2017 and 2018 for this report. While these provide a visualization of the pre-season March conditions, they also provide examples of how the eddy features are pulling the “blue marlin water” in different directions. This is important for understanding the dynamics of the region. Both images for each year have the same arrows, eddy and “blue marlin water” labeling. The flow of the water was derived from our ROFFS™ sequential image analysis of Lagrangian coherent features where we study several days of satellite imagery to follow the signature water masses and their motion. An example of this years SST satellite infrared imagery in greytone can be found on the ROFFS™ website (https://roffs.com/2018/03/bahamas-conditions-january-22-march-19-2018/) showing the flow of the water around the Bahamas region during the last two months, where the darker grey water represents the warmer water.
This year’s indicator conditions are shown in Figure 5 and 6. Currently, there are only four obvious influencing clockwise and counterclockwise circulations that are rotating at different speeds and drifting in different directions at differing rates. This is half as many eddy features than during the same time last year. Due to size and space constraints we are not showing the substantial volume of the bluer “blue marlin water” farther east of Eleuthera and Cat Island here, but one can see it in the video referenced above (typically darker grey signature). Overall, as you can see in the ocean color image (Figure 6), there are already relatively large amounts of “blue marlin water” (indicated by the darker blue colors) pushing in a favorable direction into the 500-1000 fathom ledges east and northeast of Abaco Islands and into the Great and Little Abaco Canyon areas for promising early season marlin action similar to last year.
[one_half][responsive] [/responsive][/one_half] [one_half_last][responsive]
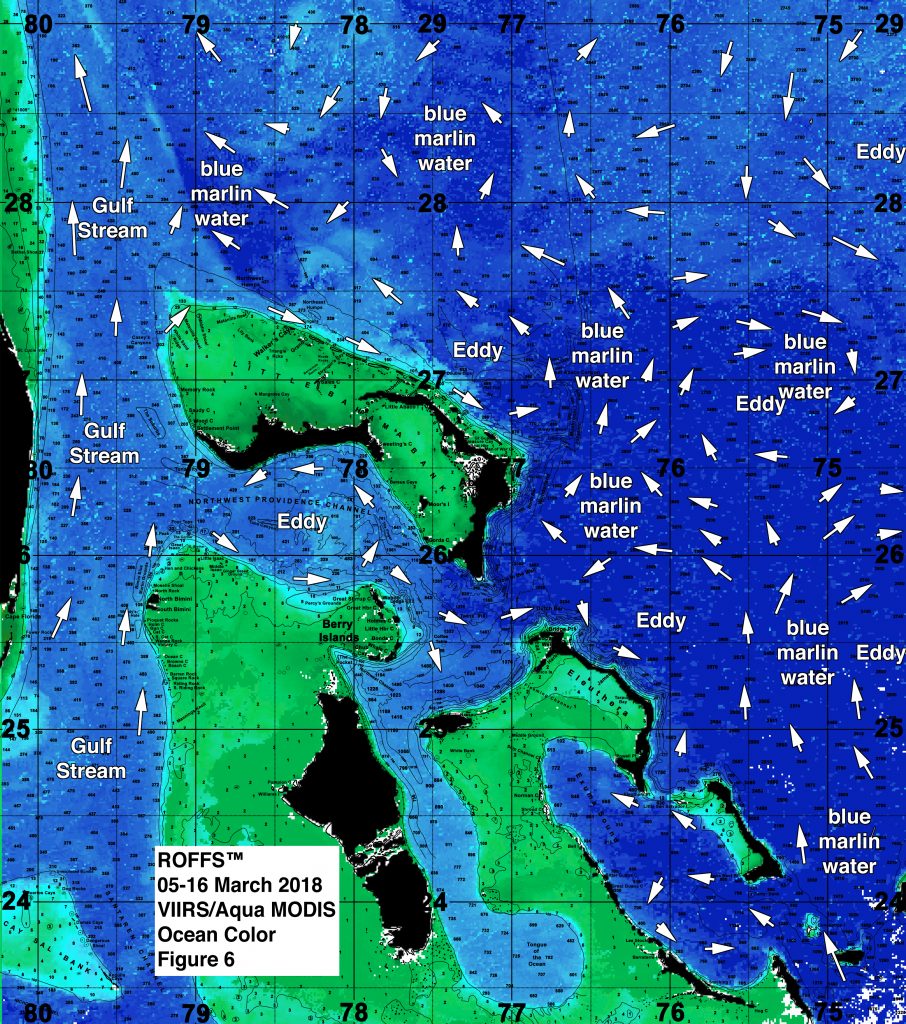 [/responsive][/one_half_last]
Figure 5: This years conditions were derived from a variety of infrared sensors to get SST from NASA, NOAA, and JPSS satellites during March 08-11, 2018 and Figure 6: Derived from the ocean color/chlorophyll imagery during March 05-16, 2018 from the VIIRS sensors on SNPP satellite in combination with the Aqua sensor on the MODIS satellite respectively. Although we needed a larger date range to provide a clear ocean color/chlorophyll image, we consider this an image pair.
Furthermore, although the “blue marlin water” is not as connected to the Gulf Stream as it had been last year, we still observe a large amount of this “blue marlin water” to the northwest and north of Abaco (almost to Walkers Canyon) similar to last year. The the west to northwest push of this slightly warmer darker “blue marlin water” continues to push toward the Gulf Stream, which is an encouraging trend that has happened over the past two years. This could mean the arrival of and earlier than normal pulse of marlin and tuna to the northern Bahamas areas and farther north within the Gulf Stream and east coast United States areas as the temperatures continue to warm.
Overall there are three main eddies we need to continue to monitor east of the Bahamas. The first eddy is the counter-clockwise eddy centered east-northeast of Eleuthera centered near 76°00’W & 25°35-38’N that is currently pulling warmer “blue marlin water” westward into the 500-1000 fathom contour depths east of Abaco, but south of Little Abaco Canyon, and then south toward the Hole in the Wall for good conditions. The second eddy is a slightly larger clockwise rotating eddy centered farther east of Great Abaco Canyon near 75°30’W & 26°50’N. These two eddies together are pulling the “blue marlin water” westward towards Abaco. If these eddy features remain relatively stable or move northward to northwestward, they will continue to provide GOOD conditions by pulling and feeding the “blue marlin water” closer to the coasts of Eleuthera, Abaco, and the rest of the northern Bahamas for good to excellent April and May fishing. However, if these eddies drift more northward to northeastward then the conditions may not be as favorable keeping the “blue marlin water” farther offshore.
The third and possibly most important eddy to keep an eye on is the dominant larger clockwise rotating eddy that is centered east southeast of Eleuthera in the lower Bahamas near 74°30-35’W & 25°20-25’N. This eddy does not appear to be drifting in any specific direction over the past three weeks, but has remained east of Eleuthera and Cat Island since mid-February. If it continues to remain east southeast of Eleuthera, it could potentially keep the larger amounts of warmer “blue marlin water” from moving north towards the smaller eddy features that will feed the “blue marlin water” into the northern Bahamas, suggesting a slower start to the fishing season. However, if this larger eddy does start to drift north-northwest and pulls the warmer “blue marlin water” east of Cat Island towards the other two eddy features, the influx of this water into the eastern Eleuthera and Abaco coastal areas will suggest better than normal marlin conditions and good catch rates for April, and likely to provide an abundance of fish for good fishing action into May and June. It remains to be seen what will happen.
The ocean color image shows darker blue water compared with the Gulf Stream water. The darkest blue water in Figure 6 shows the water that likely has the greatest abundance of the marlin and is a darker blue than the Gulf Stream water along the Florida east coast and water south of Grand Bahama Island. Although the “blue marlin water” is cooler overall than last year, there has already been an early arrival of blue marlin and yellowfin tuna caught off the Berry Islands and Abaco areas in recent weeks. The SST of the “blue marlin water” ranges between 73.8°F to 78.6°F right now and as you can see in Figure 5 and 6, there is plenty of “blue marlin water” east of Cat Island, east of Eleuthera Island over the bank and also east and north of Abaco over the 100-1000 fathom depths.
As the water warms in the coming weeks and as these eddies east of Abaco and Eleuthera hopefully move northward, we anticipate that a substantial amount of marlin and tuna will continue to arrive. These present conditions are considered good pre-season conditions, which is promising for the next month or two. Our hope for the Bahamas marlin fishing action is that while the SST is slightly cooler than last year, the temperatures are still warmer than the mean and that these fish and the conditions will remain favorable into June. However, one should note that there is also a possibility that by June the majority of these fish will be migrating farther northward if their habitat becomes unfavorably warm around the Bahamas region. ROFFS™ will be monitoring these and other conditions that develop over the next several weeks and months as we do in other areas.
When considering influences of the fishing conditions in the Bahamas over the next several weeks to months, we look downstream (east to southeast) for larger eddy features. From the NOAA/AOML CoastWatch altimeter image in Figure 7, there are four dominant eddy features (all rotating clockwise) that occur from off Abaco east-southeast to north of Hispaniola and Puerto Rico. While we continue to work with researchers that forecast eddy motion, we do not know of any reliable oceanographic models that would allow us to make accurate and reliable forecasts of the motion of these eddy features. The path, size, shape and velocities of these features are highly dynamic and the flow is complex, non-linear with interacting components.
Based on our experience, we anticipate that these eddy features will be approaching the eastern to northern Bahamas and tournament areas by mid to late spring. But it remains to be seen if they will come close enough to feed the bluer water and fish closer to the Bahamas or pull the warmer, bluer water away. Last year, there were up to eight eddy features that brought blue water into the Bahamas region throughout the season. This year, only four to five eddy features are likely to affect the amounts of blue water into the Bahamas during tournament season. This altimeter image is used as a convenience and for observing the 5-10 day estimate of the positions of the other eddies downstream in the Bahamas. However, one should remember that all such altimeter images are derived from 5-10 days of satellite data as we have discussed previously. Real-time infrared and ocean color satellite data provide more accurate and near real time information on the location of water masses and their boundaries that critically effect the distribution and relative abundance of the fish.
[responsive]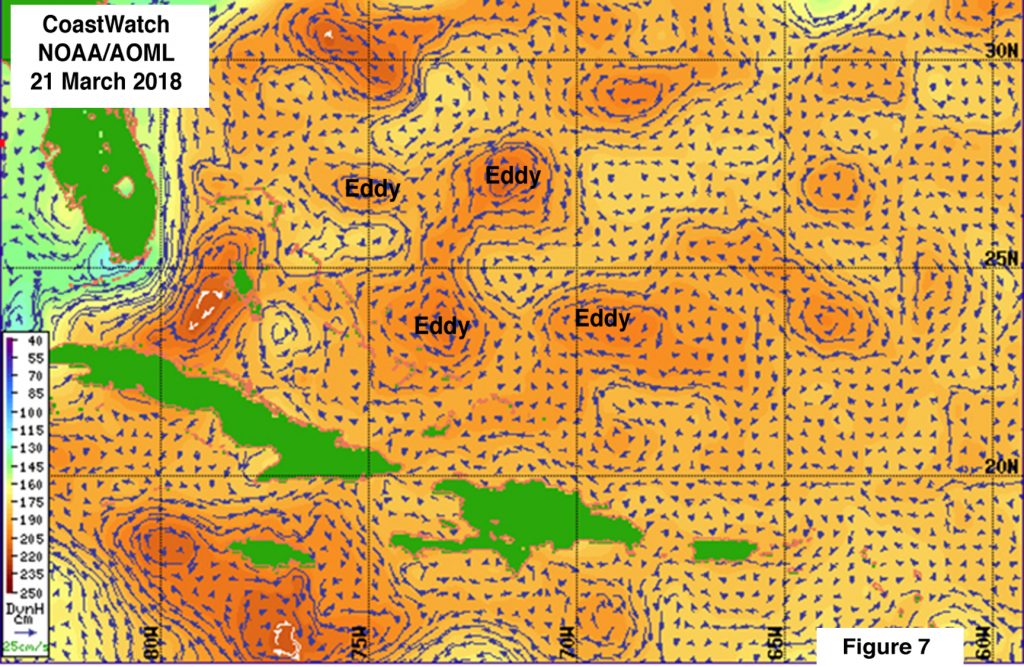 [/responsive]
Figure 7: Altimeter based currents derived for March 21, 2018. Four of the main eddy features are outlined. See (http://www.aoml.noaa.gov/phod/dataphod/work/trinanes/INTERFACE/index.html) for this data.
Seasonal Concluding Thoughts…
Based on what we have been observing over the last several weeks, the present ocean conditions for marlin, yellowfin and blackfin tuna, wahoo and mahi action in the Bahamas region, particularly in the eastern to northern Bahamas, look good. Compared to last year, the conditions this March appear similar but not quite as favorable for early fishing action but appear better for mid-spring to late spring season fishing action. However, it is important to note that last years March conditions in the Bahamas region looked better than the previous five years, putting into perspective that this year is indeed an above average year. Although there is a slight decrease in SST compared to last year, the effects will be minimal due to the large amounts of the “blue marlin water” present in the Bahamas region already. The current ocean conditions in the Bahamas suggest that the larger influx arrival of blue marlin, yellowfin tuna and other pelagics may be slightly later this year compared to last year and further east. However, conditions can change dramatically in a few weeks and some early season fishing action in early to mid March has been reported. The fishing action this year has the potential to be better than last year during the month of April and continue with good fishing conditions into May and even into early June. We will continue monitoring these developments as the season progresses and will provide updates when possible, specifically considering the effects the three large eddy features east of Eleuthera and Cat Island will have on fishing conditions throughout the season. These updates are also important for the marlin and tuna fisheries for offshore of South Carolina to North Carolina to New Jersey to Massachusetts as spring transitions to summer. Additionally, we have already received reports of early season blue marlin action off of Abaco and Berry Islands along with good wahoo and mahi action off of southeast Florida, and wahoo being caught as far north as Cape Lookout. This confirms the start of early good fishing action in the eastern to northern Bahamas and north along the U.S. Coast.
In conclusion, it is very important to note that good fishing action on a daily basis is strongly linked to local, short-term (days) current conditions that concentrate the fish once the preferred habitat of the fish are in a particular region. When the water mass boundaries of these currents are geographically stable and favorable, i.e., persistently pushing over “good” bottom topography such as Little Abaco Canyon, then they concentrate the baitfish and larger fish can be found foraging. This means that the fishing action on any given day is controlled by relatively short term (hourly to daily) and relatively small scale (1-5 mile) movements of the currents and their water mass boundaries. Our experience indicates that to reliably forecast specific concentrations of fish on a daily basis one must evaluate the ocean conditions on these scales. Relatively small subtle changes in the currents and their boundaries often have dramatic effects on the distribution and concentration of fish. Contact ROFFS™ for these daily detailed fishing forecasting analyses and get the inside track to where the better conditions are tomorrow. Get ready now for the spring Bahamas tournaments and other fun fishing action as the good fishing action the Bahamas region is starting already.
Safe and Successful Fishing from ROFFS™