Please click here to view full 2021 ROFFS™ South Season Fishing Forecast as a PDF.
Southern Florida to Cape Hatteras Spring Season Preview 2021: UPDATE ON U.S. EAST COAST GULF STREAM CONDITIONS
By ROFFS™ | James L. W. King
ROFFS™ continues its spring preview series by providing an overall update of the oceanographic conditions during early April for the east coast of the United States from the Florida Keys north to Cape Hatteras, NC including the entire offshore Gulf Stream region. As always, we have used a combination of many different data sets, but mainly sea surface temperature (SST) and ocean color/chlorophyll images. We will discuss these overall ocean conditions for the present spring season and how these conditions may translate to the near future fishing season.
For forecasting short-term oceanographic conditions related to finding fish, ROFFS™ uses real-time direct observations via satellite data. We have learned that evaluating the pre-season conditions, along with regional climate models, provides insight into future seasonal trends for fishing. Experience and understanding of the ocean – atmospheric dynamics is our guide as we have had moderate success in forecasting seasonal trends of fishing productivity based on the stepwise progression in the location of the fishes’ preferred habitat, based on temperature and water color. Please reference our 2021 Bahamas forecast for more in-depth discussion on the environmental and climate indicators that goes into our detailed evaluation of the southeastern United States fishing forecasting analysis (Click Here).
Background and Some Observations for 2021
It is important to look at the year-to-year trends including the anomalies to gain insight into the location and condition of the fishes’ preferred habitat compared with previous years. Comparing similar locations and features to last year during the same early April time period we found that the SST of the core of the Gulf Stream off of Miami, FL for 2021 is approximately 0.5-0.8°F cooler (at 80.5°F) compared to 81.0°F-81.3°F in 2020. Additionally, the eastern side of the Gulf Stream north of the Bahamas has been less stable than last year with a combination of several large, counter-clockwise rotating cold-core eddy formations and the release of smaller eddy filaments east of Cape Canaveral and Daytona Beach. This placed the eastern side of the Gulf Stream approximately 90-100 miles east of Cape Canaveral versus approximately 75 miles east in 2020. Offshore of Jacksonville, FL the SST of the core of the Gulf Stream appears to be 0.5°F cooler, at approximately 79.1°F, than 2020 at 79.6°F.
Continuing north, the SST from Charleston, SC to Cape Hatteras within the core of the Gulf Stream is slightly warmer this year, at approximately 78.9-79.4°F, than in 2020 (approximately 78.4-78.9°F). These SST differences are not considered statistically significantly differences from last year within the core of the Gulf Stream. Similar to 2020, relatively large Gulf Stream eddy formations south of Cape Fear to Cape Lookout have kept the core of the Gulf Stream offshore for parts of February and March. However, inshore conditions in Long Bay and Onslow Bay were warmer in 2021 (65°F-66°F) compared to 2020 (60°F-62°F) due to a Gulf Stream eddy filament that pushed inshore in early March, 2021.
Nowcast Analysis
The Gulf Stream Current, including its related eddies and filaments along the current’s eastern and western side are the preferred habitat of the highly migratory species for this time of year and are the most important conditions that we are monitoring. It is the day-to-day and hour-to-hour movements of these Gulf Stream related features that are important to monitor when deciding where to fish on a daily basis. Although we are only showing a two-to-three-day snap shot of the conditions in this report from early April (Figure 1a/b and 2a/b), we can discuss briefly the trends we see based on these early spring oceanographic conditions and related fishing reports that may provide insight into the near-future fishing season.
Figures 1a/b were derived from a variety of U.S. and European satellites during the early April (April 05-06, 2021 and April 02-03, 2020) period and Figures 2a/b were derived from U.S. SNPP VIIRS, Aqua/Terra MODIS ocean color/chlorophyll, and European Space Agency’s Sentinel 3 imagery during this same period (April 05-06, 2021 and April 02-05, 2020). As the exact values of the original data from different satellite sensors (VIIRS and MODIS) are not the same, we cross-calibrated the data to derive images that have realistic and consistent watercolor. This is one of the many techniques that we derived during the valuable NASA Earth Science Program projects that ROFFS™ has been involved with.
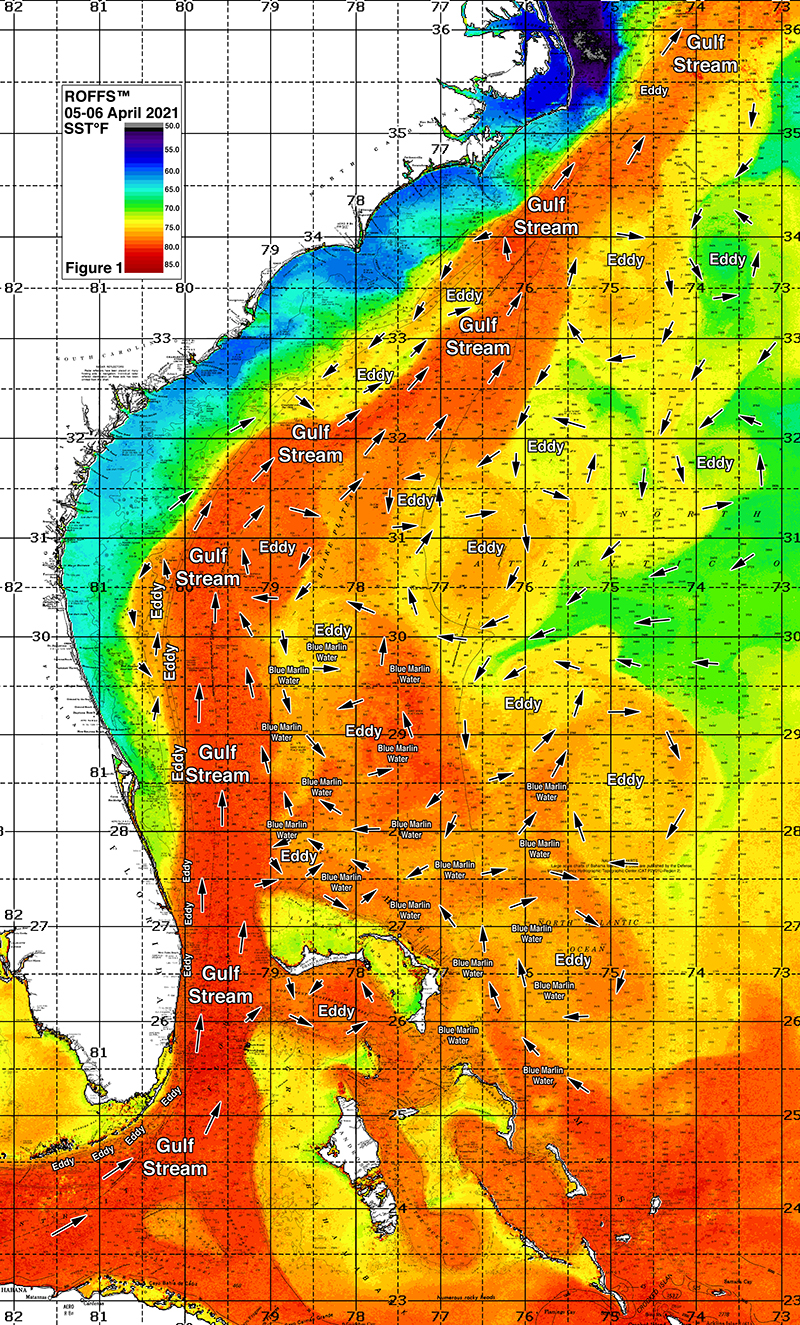
Figure 1a: This year’s Florida Keys to Cape Hatteras, NC conditions were derived from a variety of infrared sensors to get SST from NASA, NOAA, JPSS and ESA satellites during April 05-06, 2021. Main features and surface currents are labeled.
[/et_pb_text][/et_pb_column][et_pb_column _builder_version=”4.6.3″ _module_preset=”default” type=”1_2″][et_pb_text _builder_version=”4.6.3″ _module_preset=”default” hover_enabled=”0″ sticky_enabled=”0″]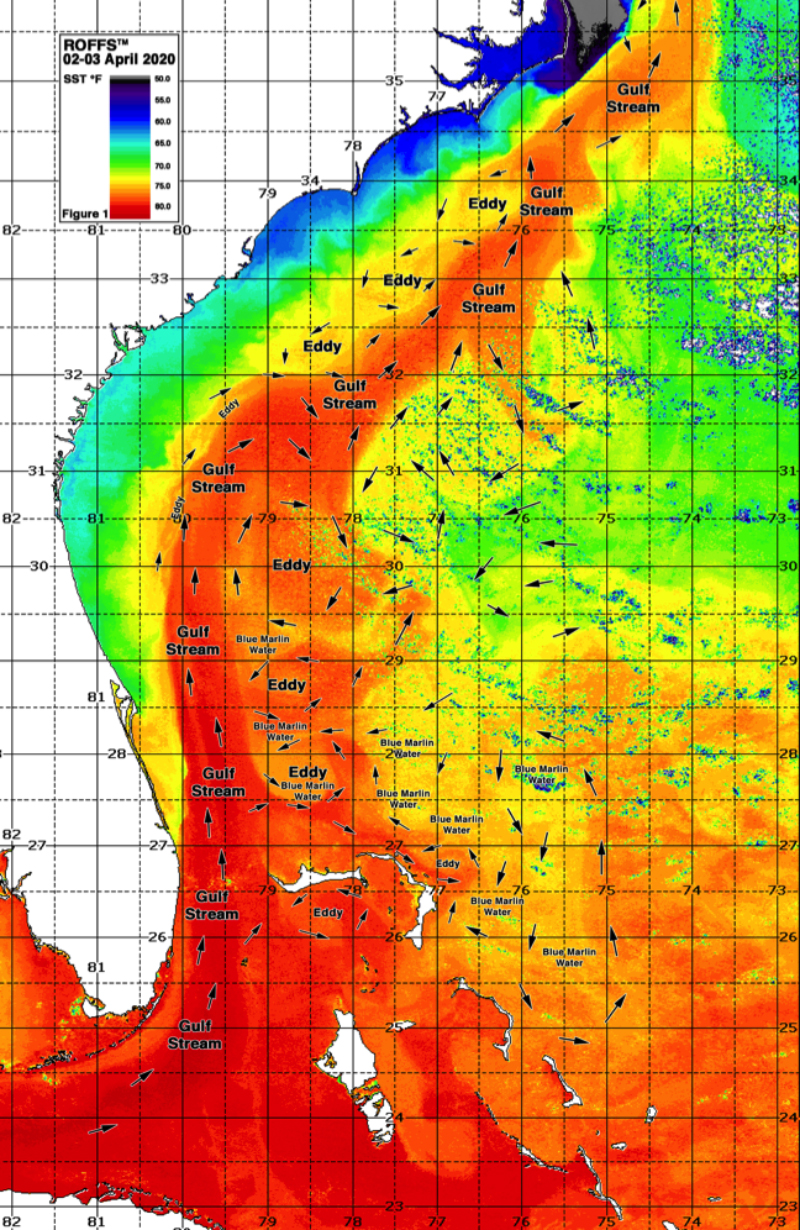
Figure 1b: Last year’s Florida Keys to Cape Hatteras, NC conditions were derived from a variety of infrared sensors to get SST from NASA, NOAA, JPSS and ESA satellites during April 02-03, 2020. Main features and surface currents are labeled.
[/et_pb_text][/et_pb_column][/et_pb_row][et_pb_row _builder_version=”4.6.3″ _module_preset=”default” column_structure=”1_2,1_2″][et_pb_column _builder_version=”4.6.3″ _module_preset=”default” type=”1_2″][et_pb_text _builder_version=”4.6.3″ _module_preset=”default” hover_enabled=”0″ sticky_enabled=”0″]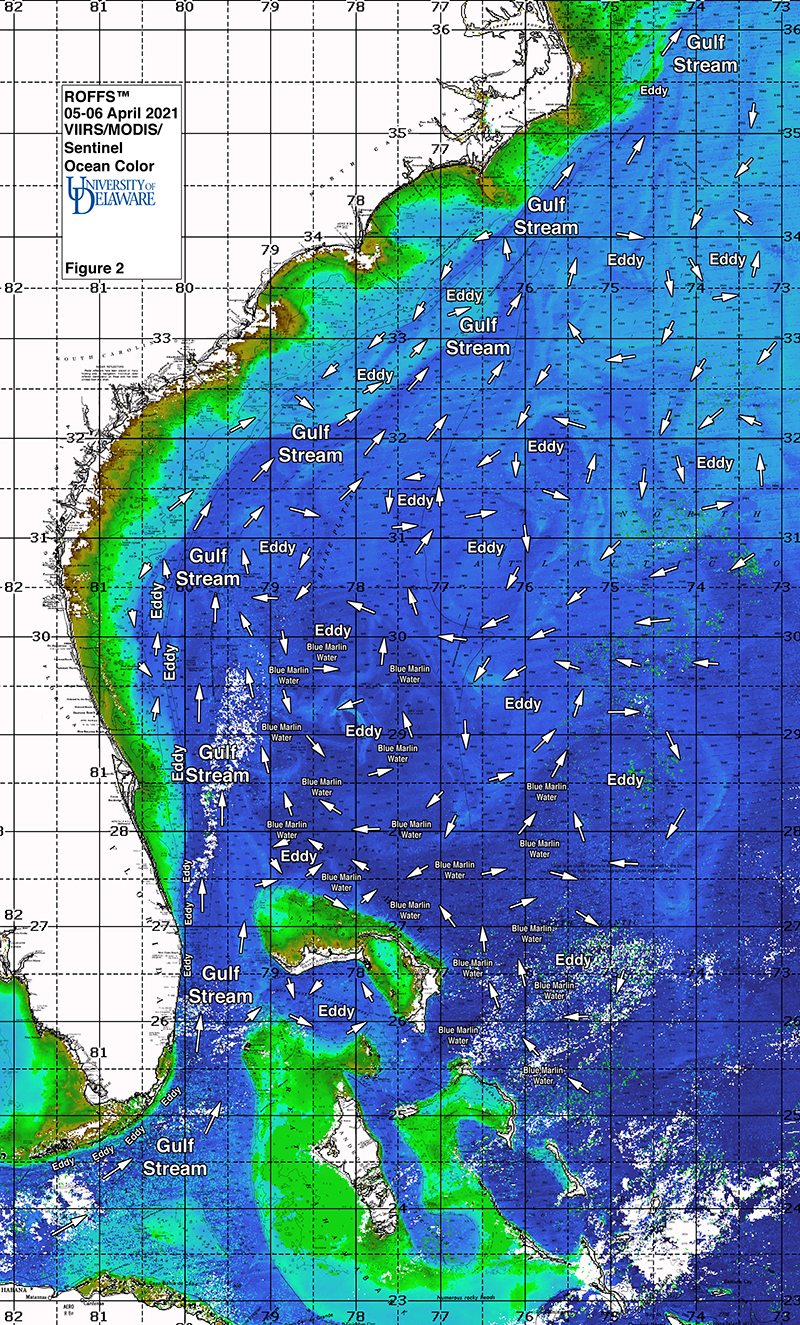
Figure 2a: This year’s Florida Keys to Cape Hatteras, NC conditions derived from the ocean color/chlorophyll imagery during April 05-06, 2021 from the VIIRS sensors on SNPP satellite and the Aqua and Terra sensors on the MODIS satellite provided by University of Delaware in combination with the ESA’s Sentinel 3 satellites. We consider this an image pair with the above SST Figure 1a image. Same main features and surface currents labeled.
[/et_pb_text][/et_pb_column][et_pb_column _builder_version=”4.6.3″ _module_preset=”default” type=”1_2″][et_pb_text _builder_version=”4.6.3″ _module_preset=”default” hover_enabled=”0″ sticky_enabled=”0″]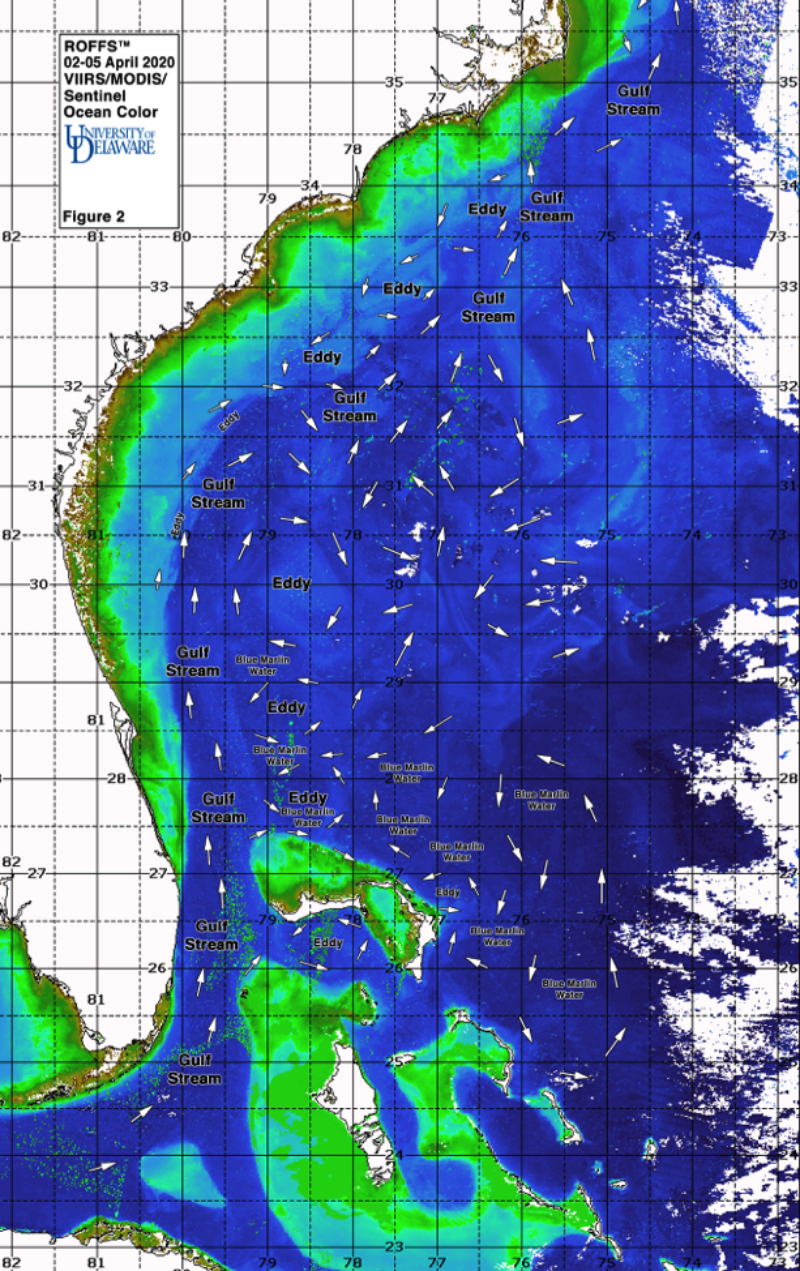
Figure 2b: Last year’s Florida Keys to Cape Hatteras, NC conditions derived from the ocean color/chlorophyll imagery during April 02-05, 2020 from the VIIRS sensors on SNPP satellite in combination with the Aqua and Terra sensors on the MODIS satellite provided by University of Delaware in combination with the ESA’s Sentinel 3 satellites. We consider this an image pair with the above SST Figure 1b image. Same main features and surface currents labeled.
[/et_pb_text][/et_pb_column][/et_pb_row][et_pb_row _builder_version=”4.6.3″ _module_preset=”default”][et_pb_column _builder_version=”4.6.3″ _module_preset=”default” type=”4_4″][et_pb_text _builder_version=”4.6.3″ _module_preset=”default” hover_enabled=”0″ sticky_enabled=”0″]We were able to use imagery from April 5th and 6th for this year’s analysis. The directional flow of the water was derived from our ROFFS™ sequential image analysis, following the water from image to image based on the water masses distinct, i.e. signature value. An example of this years SST satellite infrared imagery in greytone can be found on the ROFFS™ YouTube™ site (Click Here). Viewing the movie will allow one to follow the flow of the water and numerous eddies within the Gulf Stream region from offshore of eastern and southern Florida to North Carolina during the last month, where the darker greytoned water represents the warmer water and white indicates clouds.
Conclusion
Based on what we have been observing over the last several weeks, the present overall early April ocean conditions (SST) for the Gulf Stream region between the Florida Keys to Cape Hatteras, NC appears slightly cooler than what we had observed last year. However, regional variations were observed. The core of the Gulf Stream was cooler than in 2020 off of Florida, but warmer than 2020 off SC and NC. Inshore conditions near Cape Fear and Cape Lookout are warmer than last year despite an overall smaller set of Gulf Stream eddy features. The eastern edges of the Gulf Stream are less stable, but periodic pulses of greater than normal amounts of Bahamas “blue marlin water” will likely help accelerate the start of the 2021 fishing season. We have received consistent reports of fisherman catching their targeted species offshore. This suggests that the first wave of migration from the south of tuna and wahoo has already occurred with larger numbers to follow with larger amounts of dolphin and soon marlin as well. As a result, now is a good time to already be fishing or your boat should be in the water waiting for that weather window. We want you to take advantage of the good ocean conditions and the early fishing season. Once the water continues to warm after the last of the seasonal cool fronts pass through, the offshore fishing season will have begun over most of the areas from Cape Canaveral to Cape Hatteras. As such, this past weekend (April 09-11) was likely the last of the larger seasonal cool fronts. It will not be long until the main migration of marlin, yellowfin tuna and mahi will be available off of North and South Carolina.
It is important to note that good fishing action on a daily basis is strongly linked to local, short-term (daily) current conditions that concentrate the fish once their preferred habitats are in a particular region. When the water mass boundaries associated with these currents are geographically stable and favorable, i.e., persistently pushing over “good” bottom topography and/or in a favorable inshore direction, then they concentrate the baitfish, and larger fish can be found foraging. Relatively short-term (hourly/daily) and relatively small-scale (1-5 mile) movements of the currents and their associated water mass boundaries are often in control of the level of fishing productivity on any given day. Our experience indicates that to reliably forecast specific concentrations of fish on a daily basis one must evaluate the ocean conditions on these scales. Relatively small subtle changes in the currents and their associated water mass boundary zones often have dramatic effects on the distribution and concentration of fish.
The Gulf Stream conditions change rapidly so it becomes even more important to contact ROFFS™ (321.723.5759 / fishing@roffs.com / www.roffs.com) for the daily up-to-date detailed fishing forecasting analyses and get the inside track to where the better conditions will be tomorrow. We continue to monitor the coastal southeastern U.S. Ocean conditions especially the Gulf Stream and its related eddy features and how it relates to the local fishing environment as the larger recreational and tournament fishing season approaches. Get out and fish now and maximize your fishing experience by using ROFFS™ to locate the good spring conditions near you.
Safe and Successful Fishing
[/et_pb_text][/et_pb_column][/et_pb_row][/et_pb_section]