
Monitoring of the Hurricane Harvey Plume in the Gulf of Mexico
[/et_pb_text][/et_pb_column][/et_pb_row][/et_pb_section][et_pb_section fb_built=”1″ _builder_version=”3.19.17″][et_pb_row _builder_version=”3.19.17″][et_pb_column type=”4_4″ _builder_version=”3.19.17″][et_pb_text _builder_version=”3.19.17″]Monitoring of the Hurricane Harvey Plume in the Gulf of Mexico
NASA ROSES Solicitation NNH17ZDA001N-RRNES
M.A. Roffer1 (PI), G. Gawlikowski1 (Co-I) and M. Upton1 (Co-I)
Roffer’s Ocean Fishing Forecasting Service, Inc. West Melbourne, FL 32904
Final Report
Summary
This project succeeded in tracking, mapping and spatially analyzing the freshwater plume runoff in the northwest Gulf of Mexico resulting from Hurricane Harvey hitting the Texas coast on August 25, 2017 using a combination of ocean color and infrared satellite imagery. Twenty-four weeks of satellite data were derived from NASA, NOAA and the European Space Agency (ESA) using a variety of polar orbiting platforms. It was determined that the freshwater plume signal, derived primarily from sea surface derived chlorophyll measurements, had a surface area expansion peak and mean of 2.14 and 1.57 times the pre-storm mean within the northwest Gulf of Mexico.
Weekly summaries and geo-referenced maps and results are provided on the ROFFS™ website (https://roffs.com/research-environmental/monitoring-hurricane-harvey-plume-gulf-mexico/) and have been publicized widely through social media, press releases, and ROFFS™ newsletter. The results are being sent directly to a variety of agencies and fisheries managers via email. In addition, the distribution included fishers, as well as, the general public including educators and government representatives. The data is available via ROFFS™ website or upon request (fish7@roffs.com, 321-723-5759).
Fisheries managers need to know the spatial and temporal extent of the plume, which will assist them to evaluate which stocks are likely to be affected and what management strategies need to be modified in light of this disturbance. The beneficial impact to fisheries managers is that the derived environmental data is available for use for everyone including stock assessment scientists. Incorporating these environmental conditions should result in improved stock assessments and fisheries management in this region due to the effects of Hurricane Harvey.
This research is of high significance and likely to have a long-lasting impact due to the increased understanding of such events on the short-term and long-term impacts of tropical events on the fauna and flora in the northwest Gulf of Mexico, along with the transport and fate of the polluted water offshore. By tracking the surface ocean color – chlorophyll signal in the northwest Gulf of Mexico, we also mapped the distribution and concentration of terrestrial and ocean carbon fluxes, which is critical in understanding the carbon cycle through the ocean ecosystem and back to the atmosphere.
Results of this project have showed that ocean color satellites in particular were useful in identifying, mapping and monitoring the weekly freshwater plume runoff in the northwestern Gulf of Mexico due to the increased chlorophyll + CDOM signature of the runoff that resulted from this extreme rainfall event. Infrared satellites and the ocean color satellites were also useful in tracking the Lagrangian coherent structures of the signature water masses for diagnosing the ocean’s surface dynamics. Furthermore, as expected, results of ArcGIS spatial analysis of the direct Hurricane Harvey runoff extents showed a gradual increase in effected surface area within the northwest Gulf of Mexico until mid-October, 2017. Then one can argue it remained at or near peak surface area coverage until mid-to-late November before slightly overall decline in surface area until the end of the study period (February 01, 2018). It is of note, as we continued to follow the ocean conditions, the surface area of the Hurricane Harvey defined water did continue to decrease overall into the spring and all but mix out and disperse by early summer months, especially offshore.
It is shown and verified in this work by the increase in the extent of the direct Hurricane Harvey water that the amount of rain, subsequent flooding and runoff into the Gulf of Mexico from this hurricane is an environmental concern due to its impacts on the ecosystems of the fauna and flora of the coastal and offshore ocean. Not only is freshwater input with its turbidity and increased chlorophyll + colorized dissolved organic matter (CDOM) of concern, but the industrial and domestic household chemicals causing pollution in the water are of concern and is likely imbedded within this satellite derived Hurricane Harvey water extents defined in this project.
Images / Hurricane Harvey Runoff Weekly Summaries
Landfall Aug. 25th 2017
In order to summarize and finalize the monitoring of Hurricane Harvey freshwater plume runoff into the Northwest Gulf of Mexico, ROFFS™ added some brief dialog of the week-to-week progression and generalization of the runoff extents. This will concentrate mainly on the “green” and “turbid green” categories that together form the “Harvey Water” extents. The “Harvey/Offshore Mix” (green/blue + blue/green water) will also be discussed when appropriate.
Image 1 – August 11-17, 2017
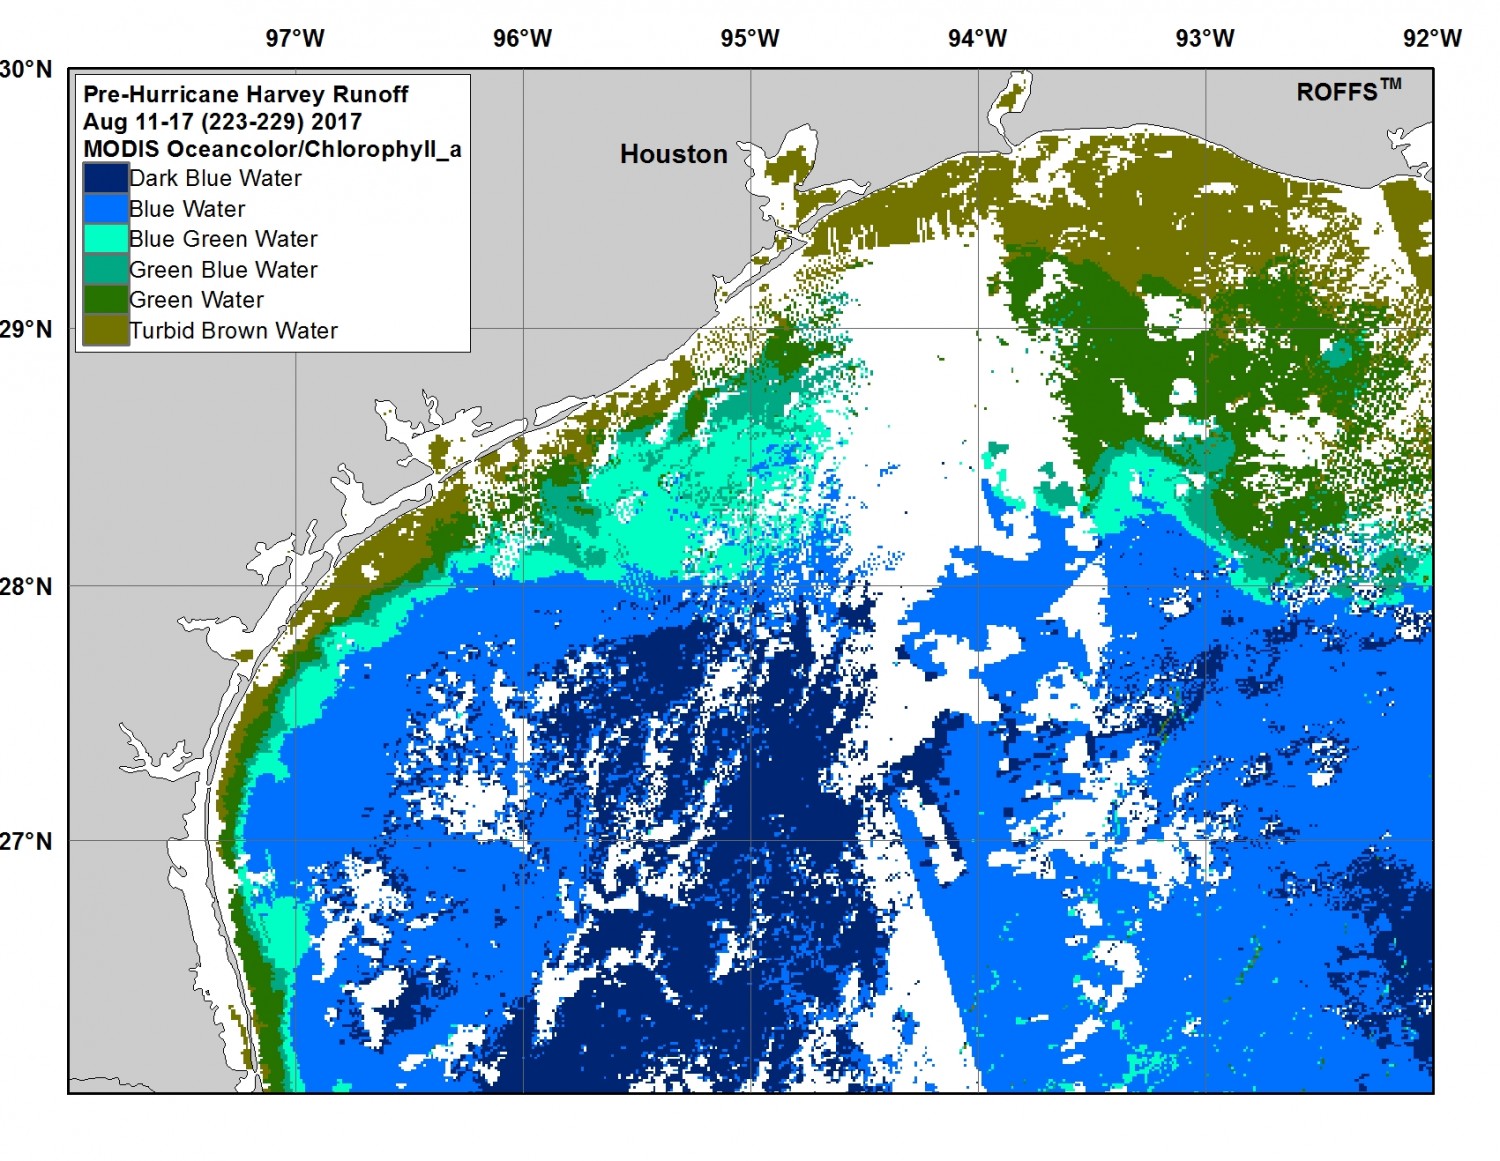
Week 1 (Aug 11-17): This image shows the conditions two weeks before Hurricane Harvey hit the coast of Texas. Of note is the relatively small extents of greener and turbid green water from South Padre Island and just offshore of Texas all the way to Houston/Galveston area. There were some trouble with cloud cover and satellite coverage this week.
Image 2 – August 18-24, 2017
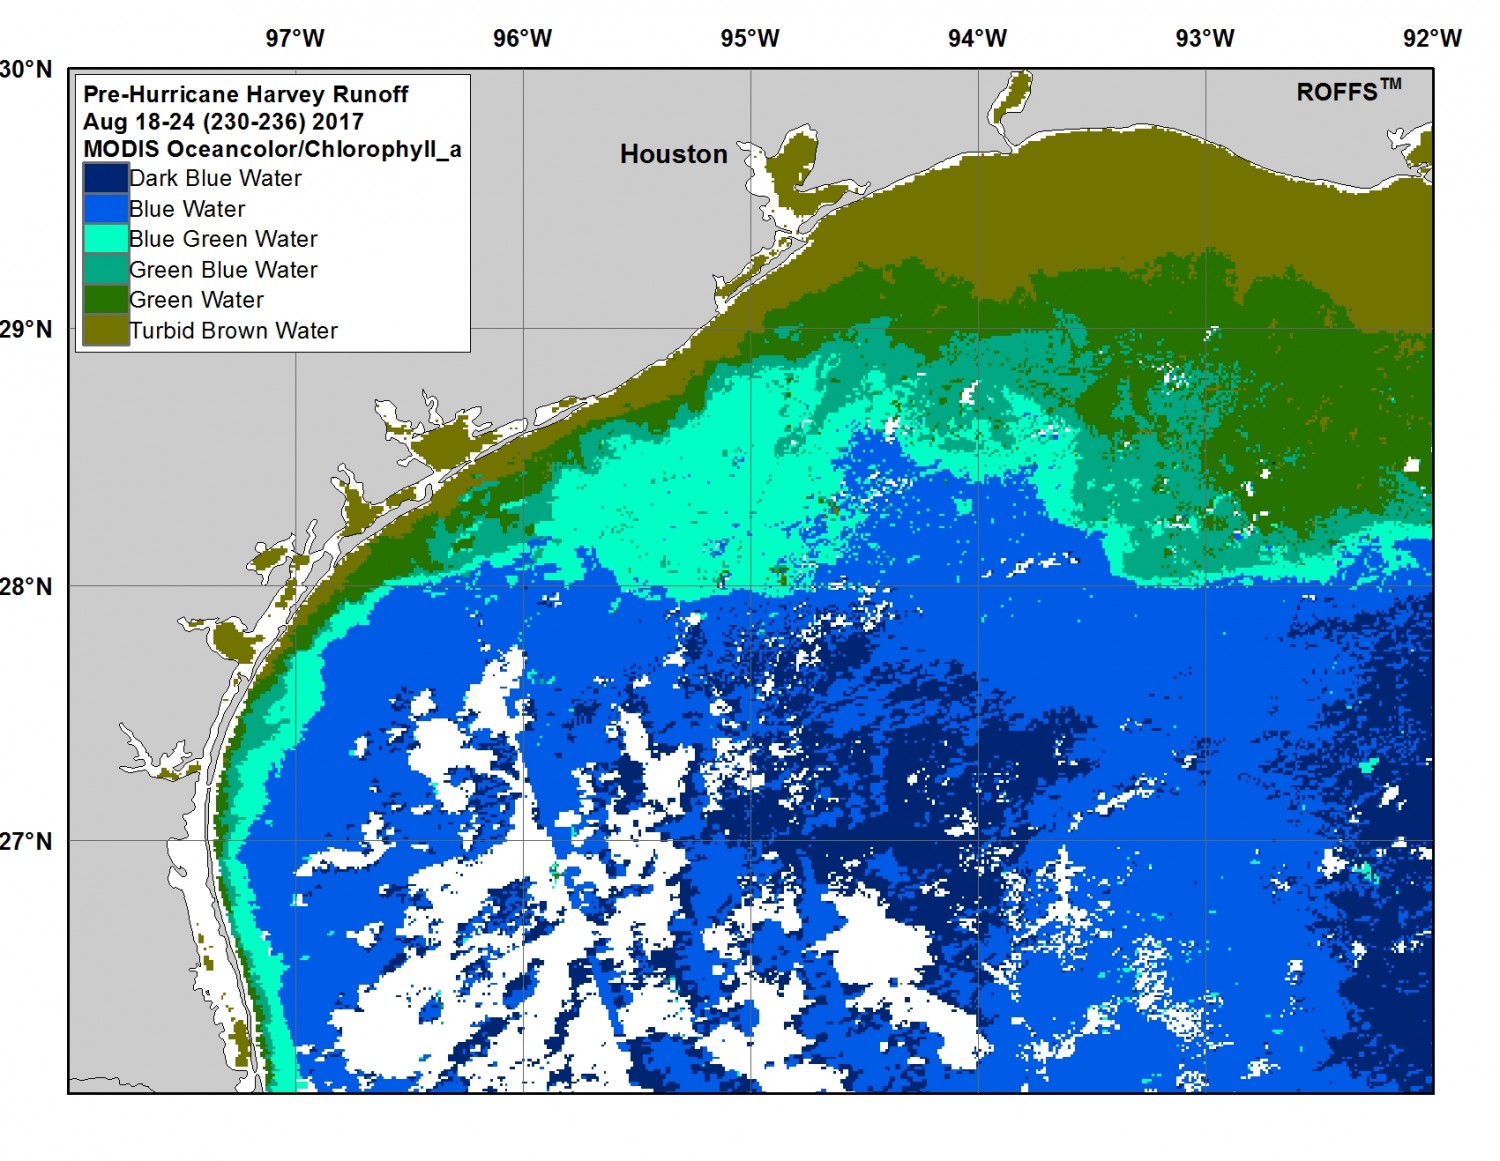
Week 2 (Aug 18-24): This week is only one week to a few days before the landfall of Harvey, and one continues to notice the relatively thin extents of greener and turbid brown water along the coast of Texas up to the Houston/Galveston area. Then the extent of greener and turbid brown water reaches further offshore from Galveston east. However, this pattern is normal for this area as the water is shallow and well mixed most of the year.
Image 3 – August 25-31, 2017
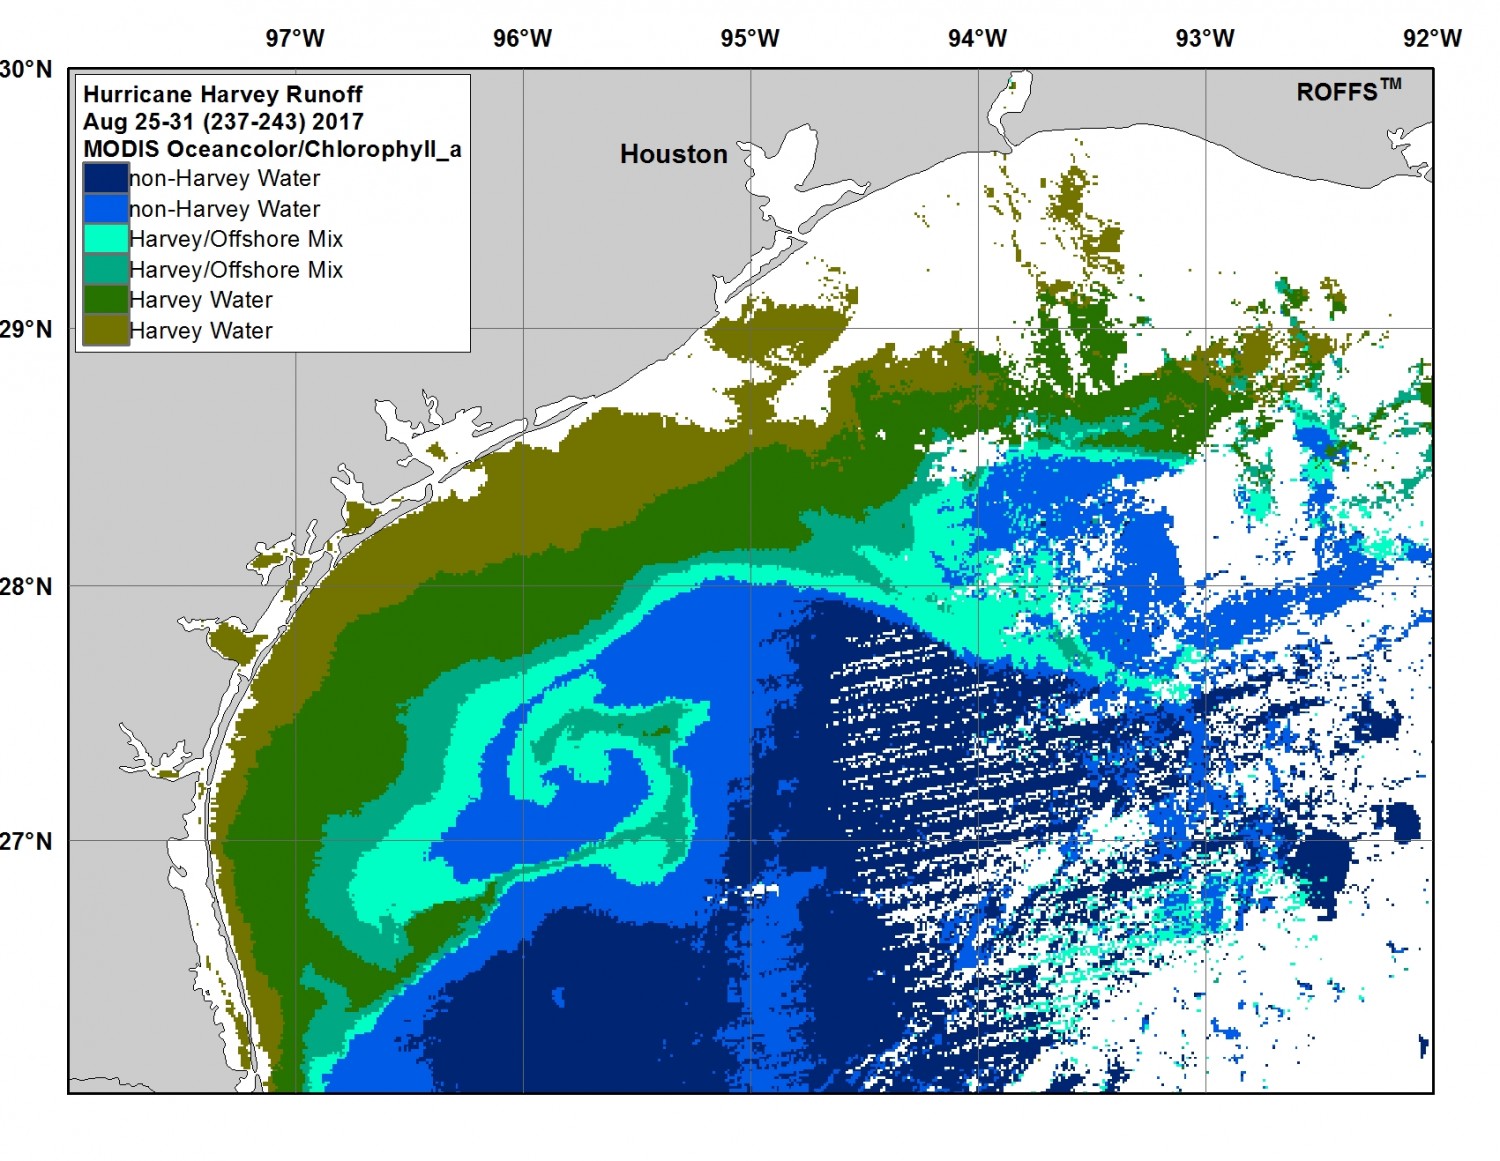
Week 3 (Aug 25-31): This week represents the week that Hurricane Harvey hit land and dumped multiple inches of rain inland on Texas and western Louisiana. Even though the north and western area of interest (AOI) had trouble with satellite coverage due to cloud cover, of note is the already much larger extent of Harvey related green and turbid green water related to freshwater and river and bay and inlet runoff into the Gulf of Mexico. When compared to the image the week before one notices that already the Harvey water extends an additional 20 to 40 miles further offshore along the coast of Texas compared to the week before the Hurricane hit. Also of note in this image is the evidence of the large counter-clockwise eddy centered offshore near 95°40’W & 27°15’N. Farther east, there is evidence that the water categorized as “Harvey/Offshore Mix” has already brushed into the Flower Garden Banks National Marine Sanctuary (Flower Gardens NMS) which is located roughly 100 nautical miles (185 km) due southeast of Galveston, TX.
Image 4 – September 1-7, 2017
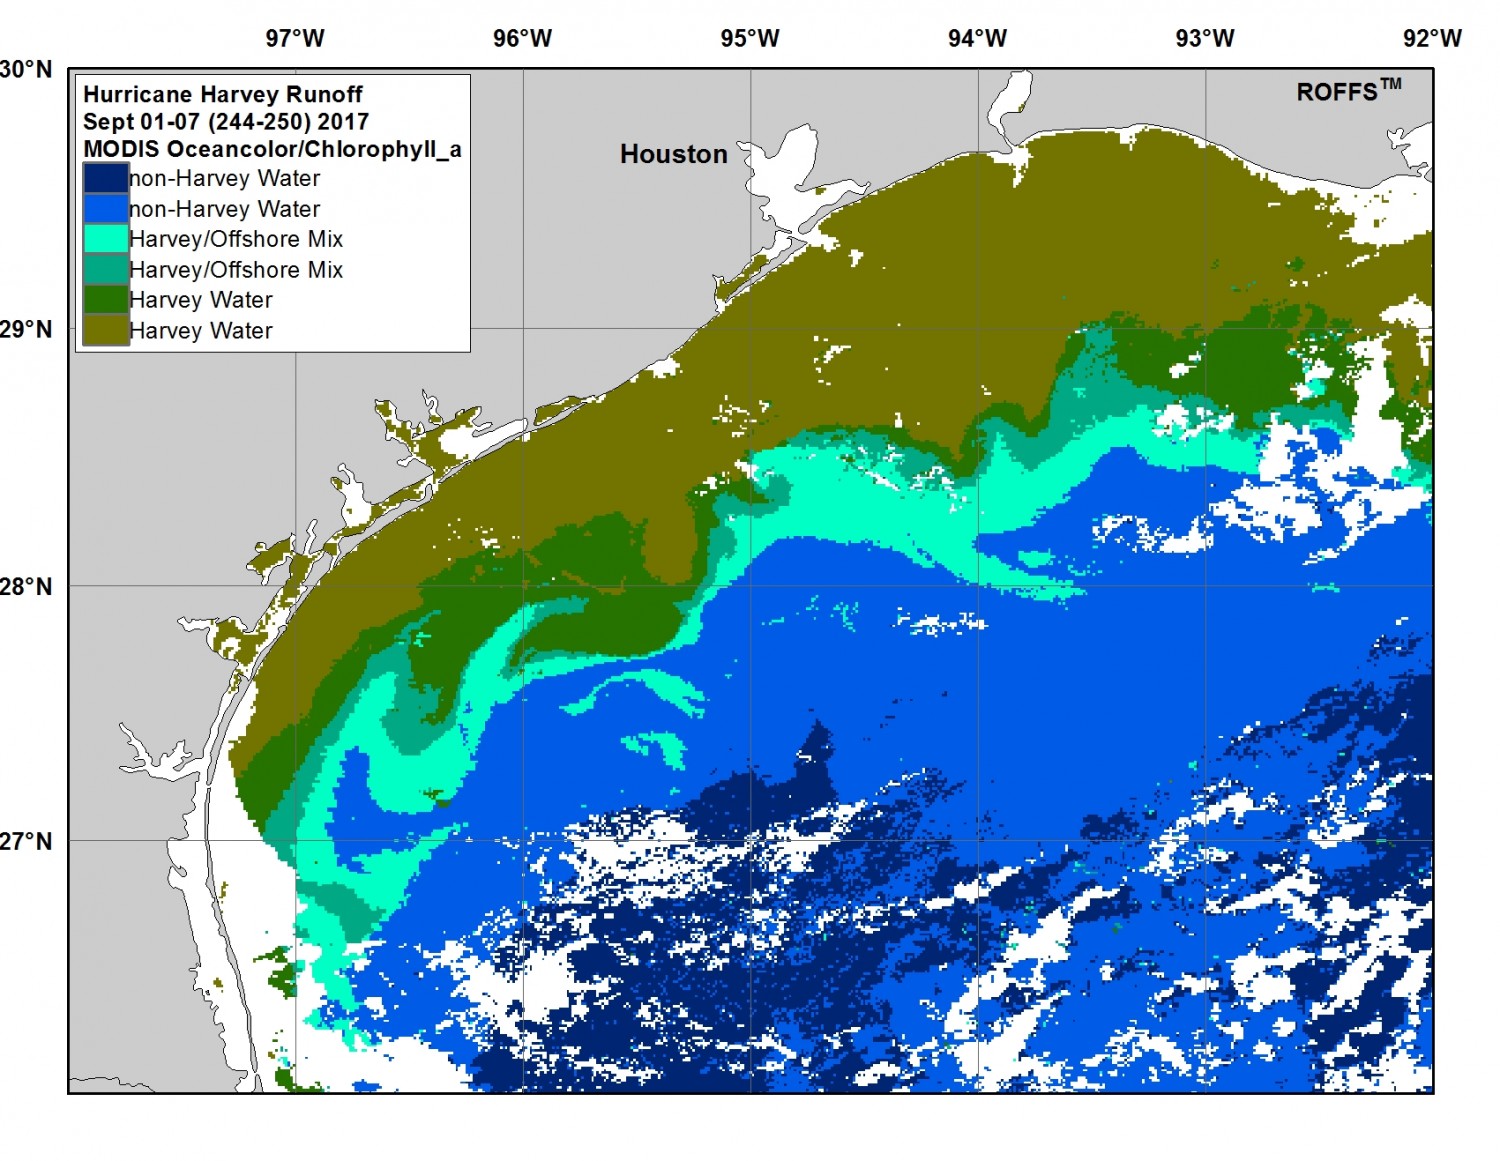
Week 4 (Sept 1-7): This next week represents the week to 14 days after Harvey hit and was a good clear coverage through most of this area. Notice the further evidence of the increase of direct Harvey water, especially the turbid brown water east and northeast of Corpus Christi extending another 5 to 15 miles further offshore specifically between the Houston and Port O’Conner area. In fact, the spatial analysis shows that the increase of Harvey water increased around 10,000 square kilometers in surface area from the week before within this AOI. Of note the Harvey/Offshore Mix also appears to brush the northern edges of the Flower Gardens NMS area.
Image 5 – September 8-14, 2017
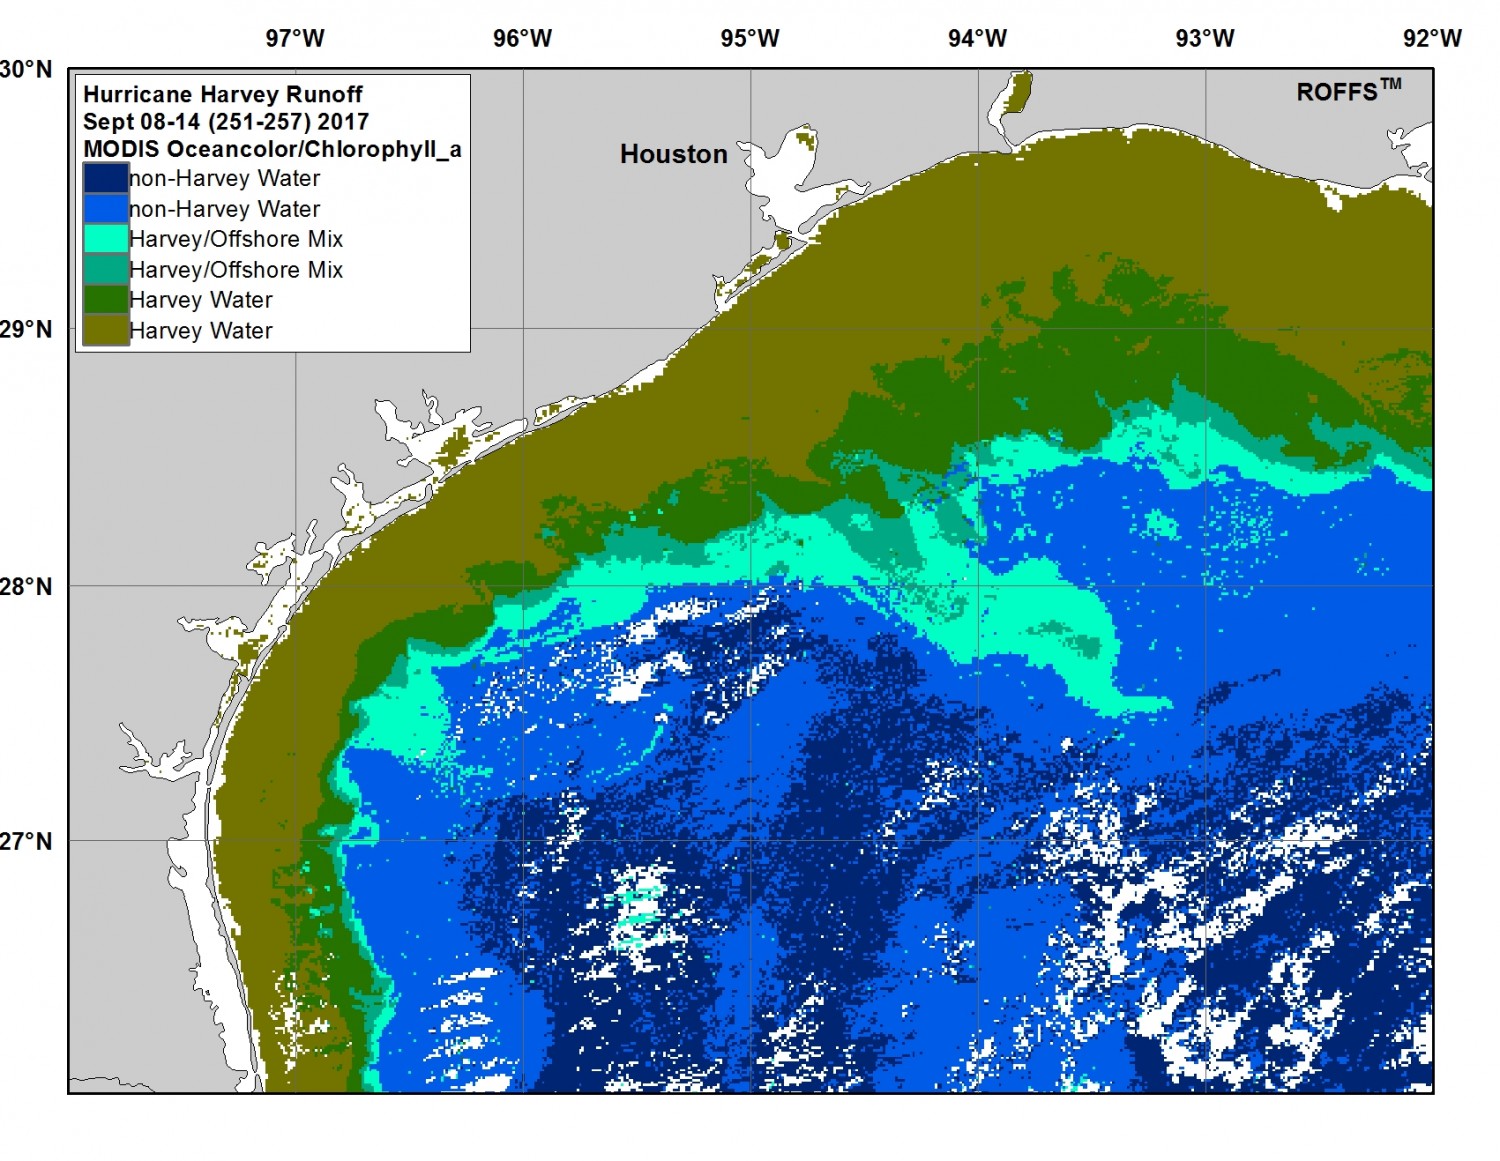
Week 5 (Sept 8-14): Three weeks after Harvey hit Texas there was great satellite coverage and evidence that the Hurricane Harvey water continues to increase its coverage and surface area offshore. Spatial analysis shows that the Harvey water increased another 9,000 square kilometers in total surface area from the week before within this AOI. Again, notice how the Harvey Water extends and expands 20-30 miles more than pre-hurricane conditions. Although the turbid brown dirtiest water has diluted a bit and decreased in surface area the green direct related Harvey water increased substantially from the week before. Also of note is that a larger amount of Harvey/Offshore mixed water is directly flowing to the southeast over the Flower Gardens NMS.
Image 6 – September 15-21, 2017
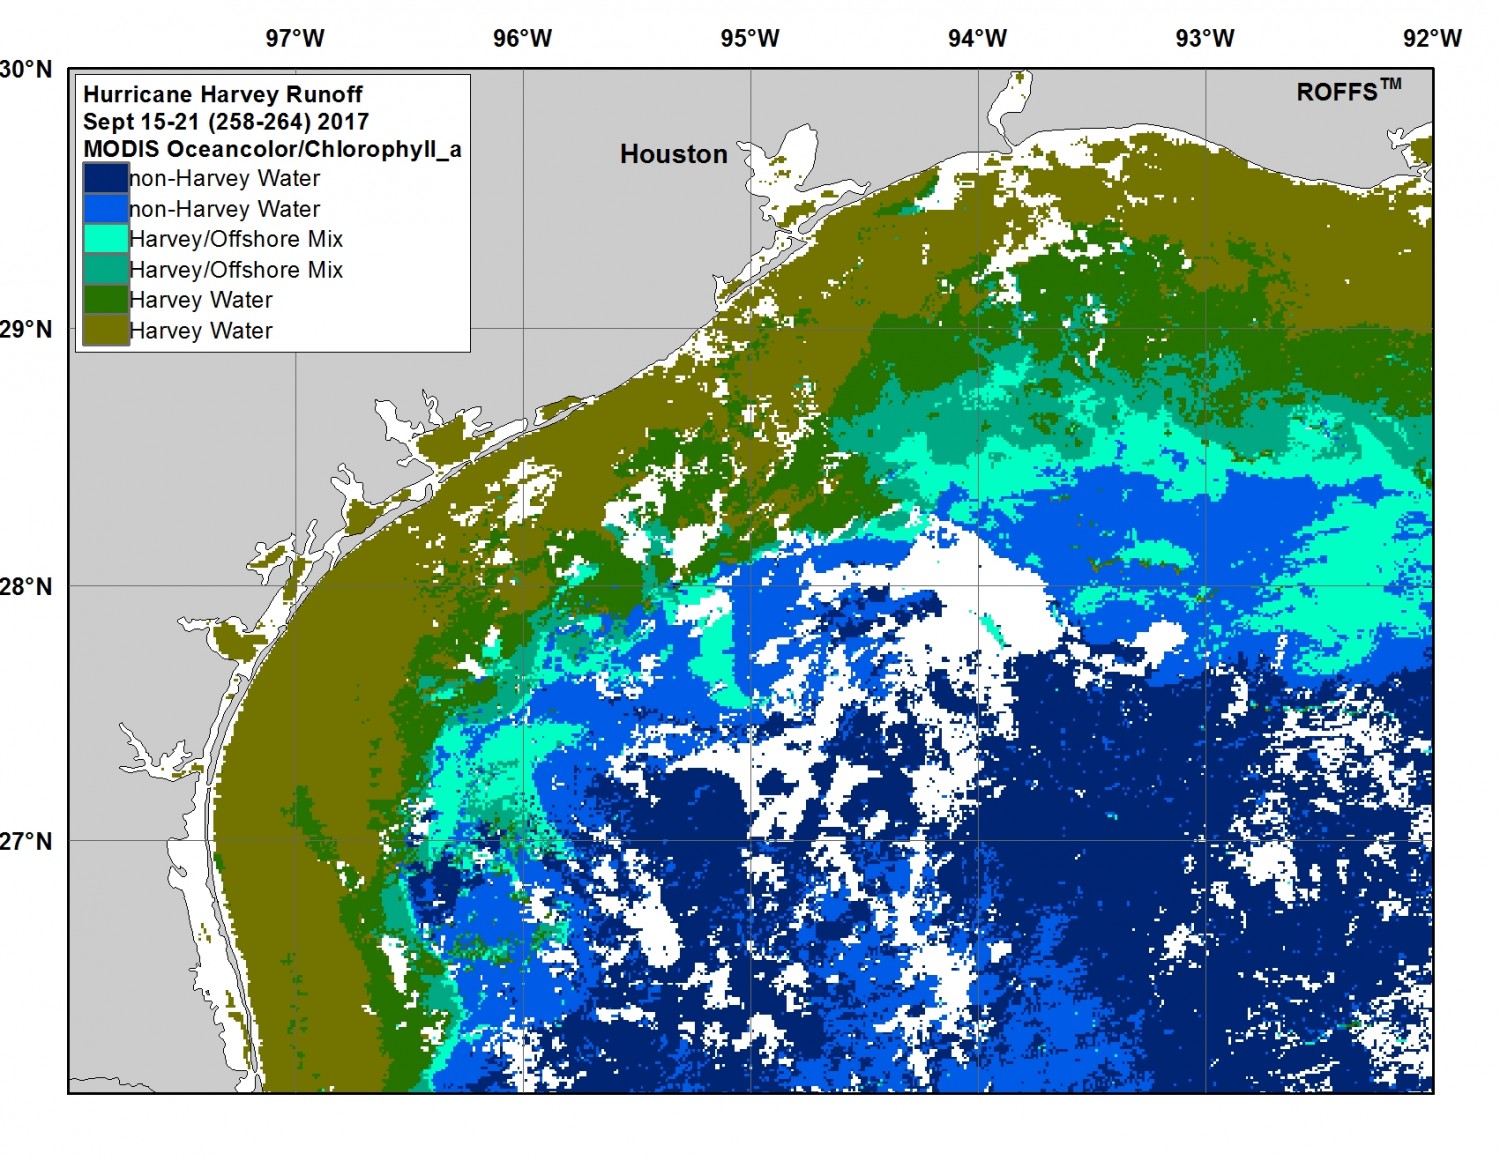
Week 6 (Sept 15-21): There were troubles with clouds in areas, but the overall similar trend of Harvey water continues. The directly related Harvey water expands farther offshore from the Mexico border to east of Port O’Conner to 100-meter depths in some areas, while the direct Harvey related water decreased slightly offshore of Houston and east of the Houston area. Even though it was cloudy in the area of the Flower Gardens NMS, evidence to the east and west shows that there is still some possible Harvey/Offshore mixed water over that area.
Image 7 – September 22-28, 2017
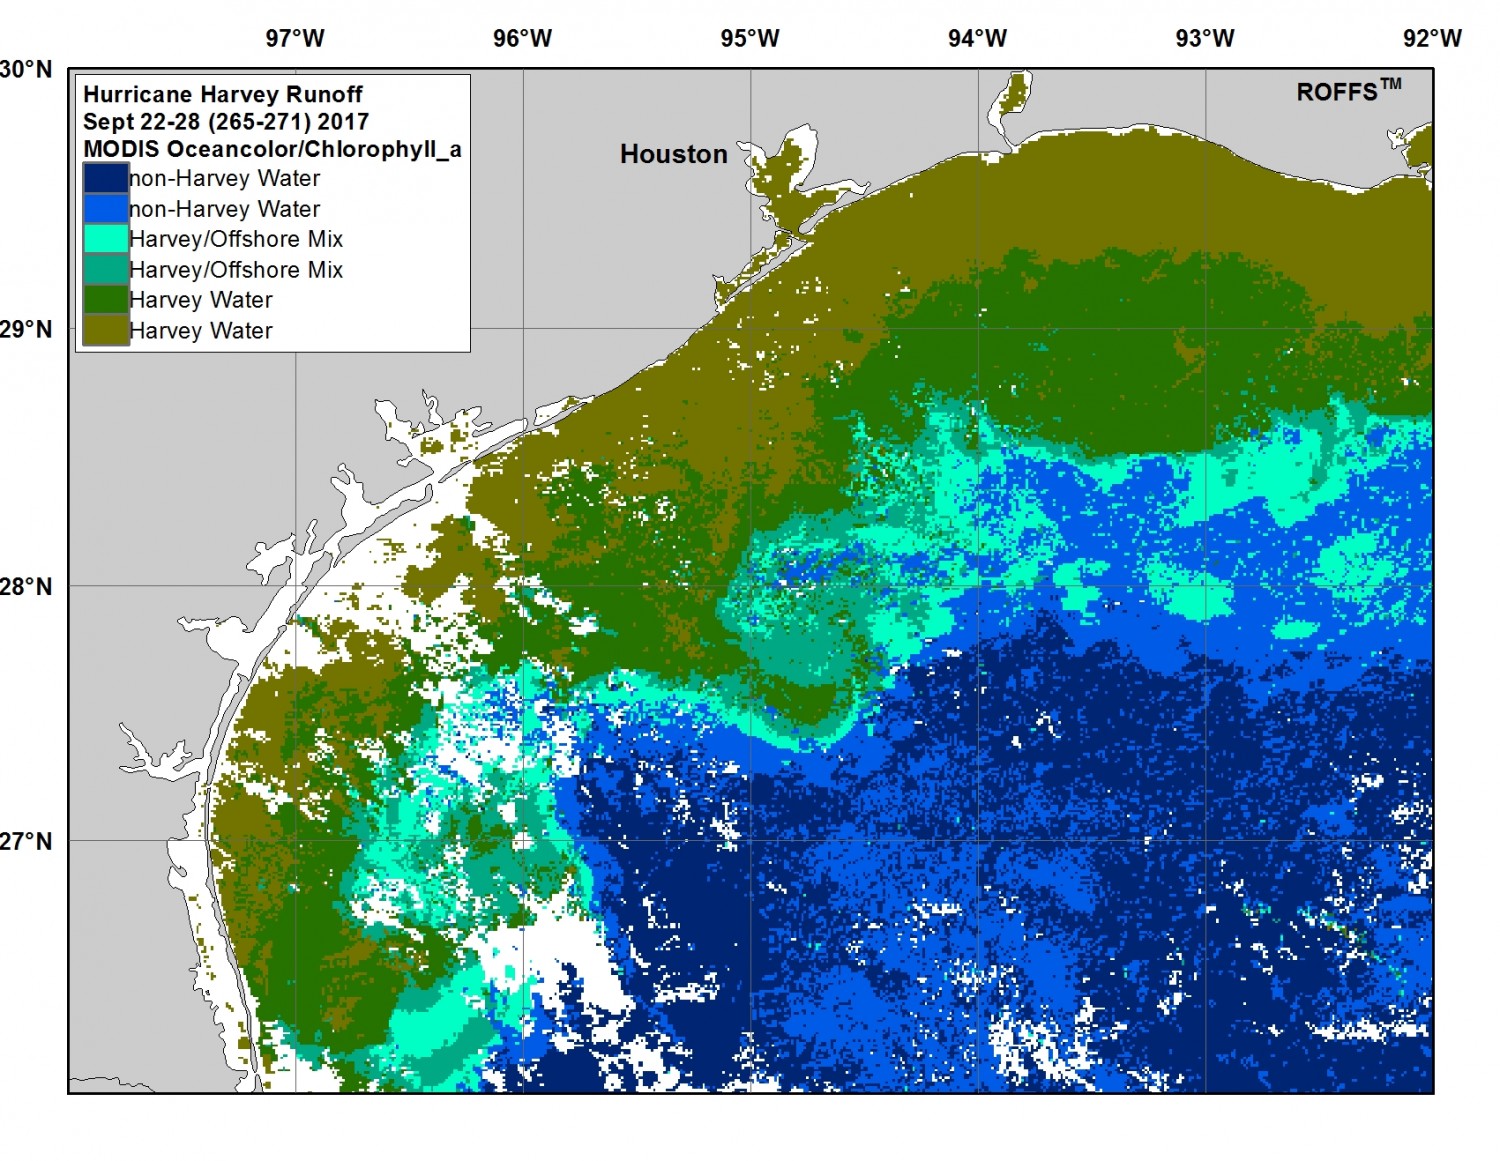
Week 7 (Sept 22-28): Even though there were spots of no data and clouds this week in this western AOI, there was the largest amount of surface area extents for both Harvey Water and Harvey/Offshore Mix since the hurricane made landfall over five weeks ago. Evidence that the rivers and inlets and bays are still cresting and spewing larger amounts of dirty Harvey related flooded water into the Gulf of Mexico. Some of this increase in Harvey water extents has to do with the evidence of two counter-clockwise rotating eddies. One centered near 94°45’W & 27°40’N and the other near 96°15’W & 26°45’N. These eddies have interacted with the inshore Harvey water pulling it farther offshore in places well offshore of 100 meter depths specifically east of Port Aransas and southeast of Port O’Conner area. There also remains a larger amount of directly related Harvey water runoff south of Houston and south of Port Arthur out 60-70 miles offshore. Harvey/Offshore mixed water appears to be near the Flower Gardens NMS area this week.
Image 8 – September 29 – October 5, 2017
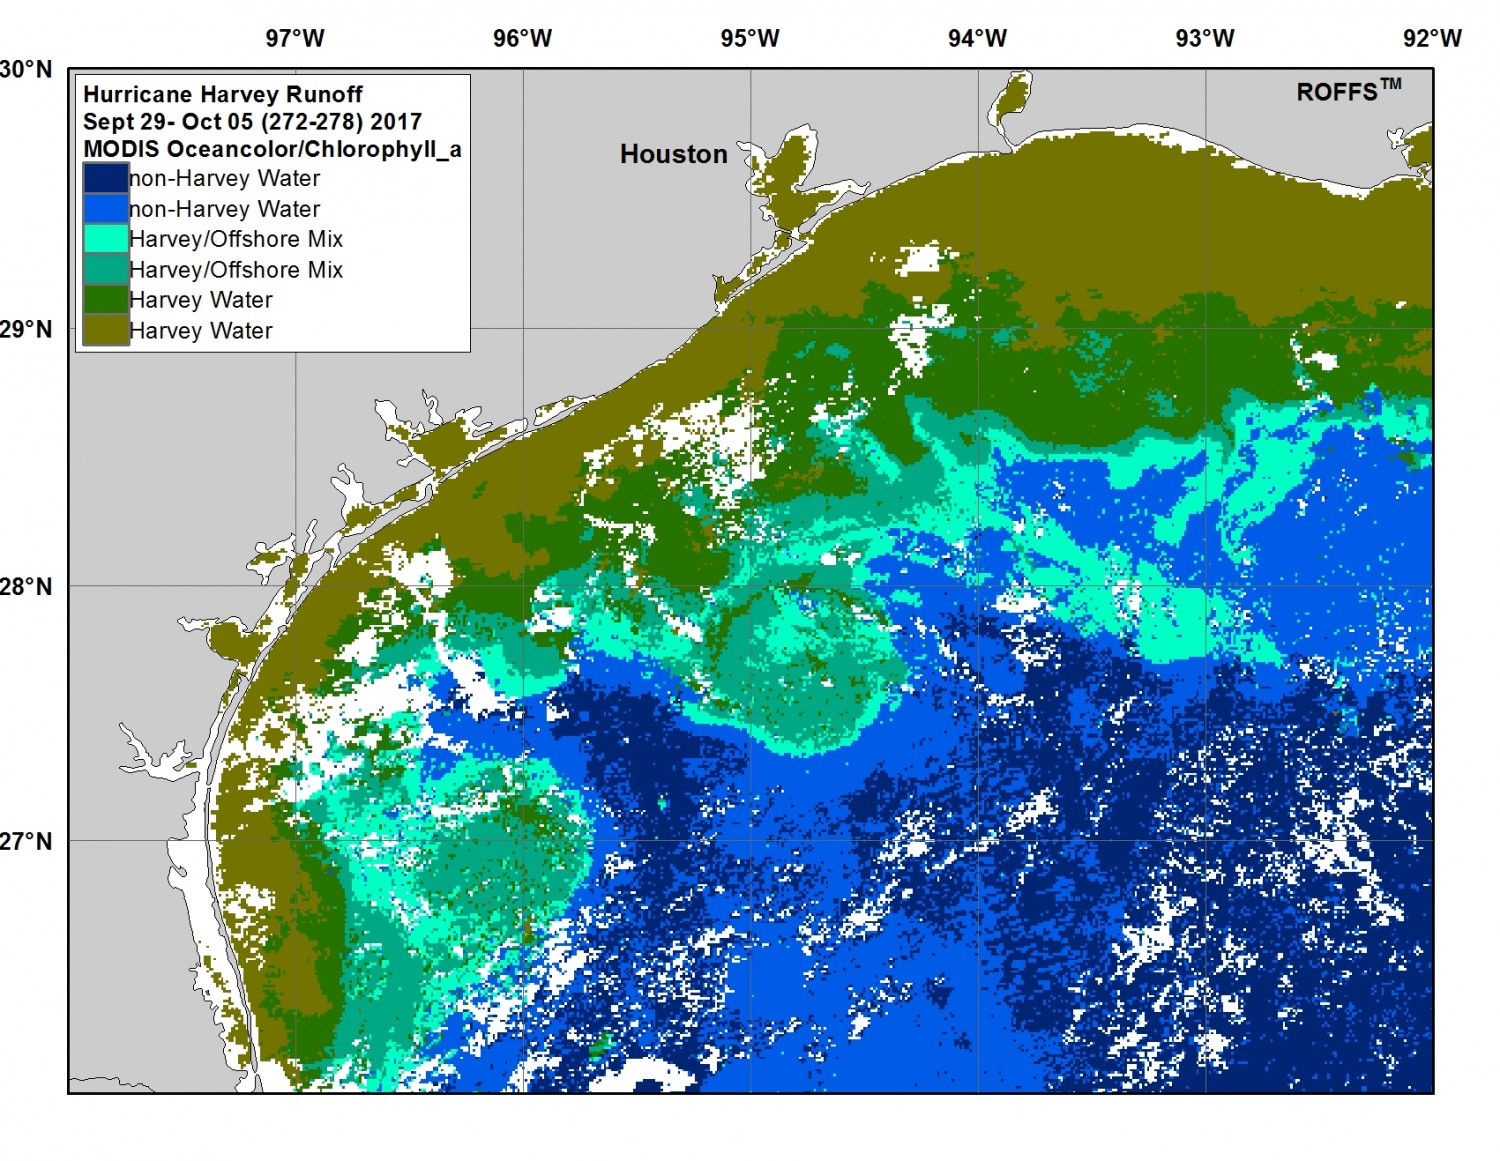
Week 8 (Sept 29- Oct 5): This week showed an overall decrease in direct Harvey related water in surface area, but a substantial increase in Harvey/Offshore mixed water well offshore of the 100 meter depths. This trend is evident the west AOI especially where the previously mentioned eddies continue to pull Harvey related water offshore and mixing it with the bluer non-Harvey water. This week there is also evidence of Harvey/Offshore mix water directly over the northern Flower Gardens NMS area as the Harvey mixed water continues to flow to the east-southeast in the area east of 94°15’W.
Image 9 – October 6 – October 12, 2017
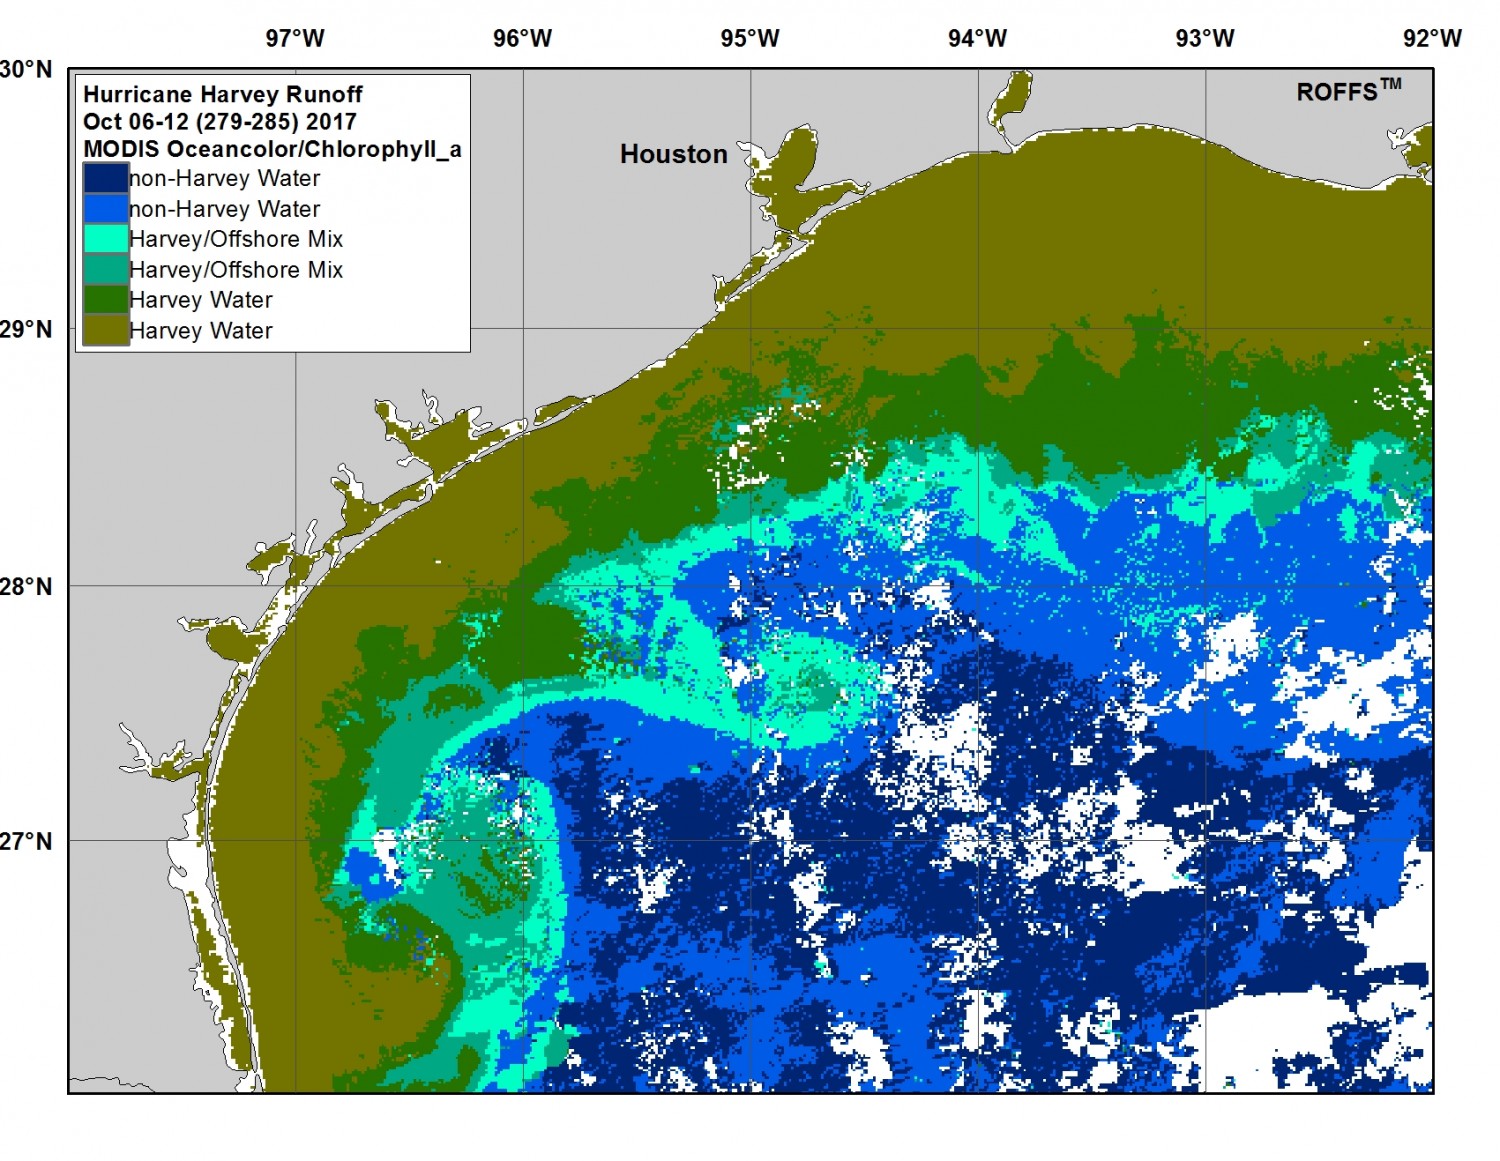
Week 9 (Oct 6-12): This week the pattern and extents look similar to the week before, however, the substantial increase in Harvey runoff water from the previous two weeks indicates that even though the storm hit over six weeks ago the freshwater runoff continues and the expansion of the Harvey extents have increased to its greatest surface area coverage for this AOI. Of note is the eastern expansion of Harvey water in southern Texas as well as the southern expansion of direct Harvey water southeast of Galveston and south of Port Arthur to western Louisiana by 10-15 miles compared to the previous week. Some direct and mixed Harvey water are in depths greater than 100 meters off the eastern Texas coast. There is trace-scattered evidence of perhaps some Harvey/Offshore mix near or over the Flower Gardens NMS area this week.
Image 10 – October 13 – October 19, 2017
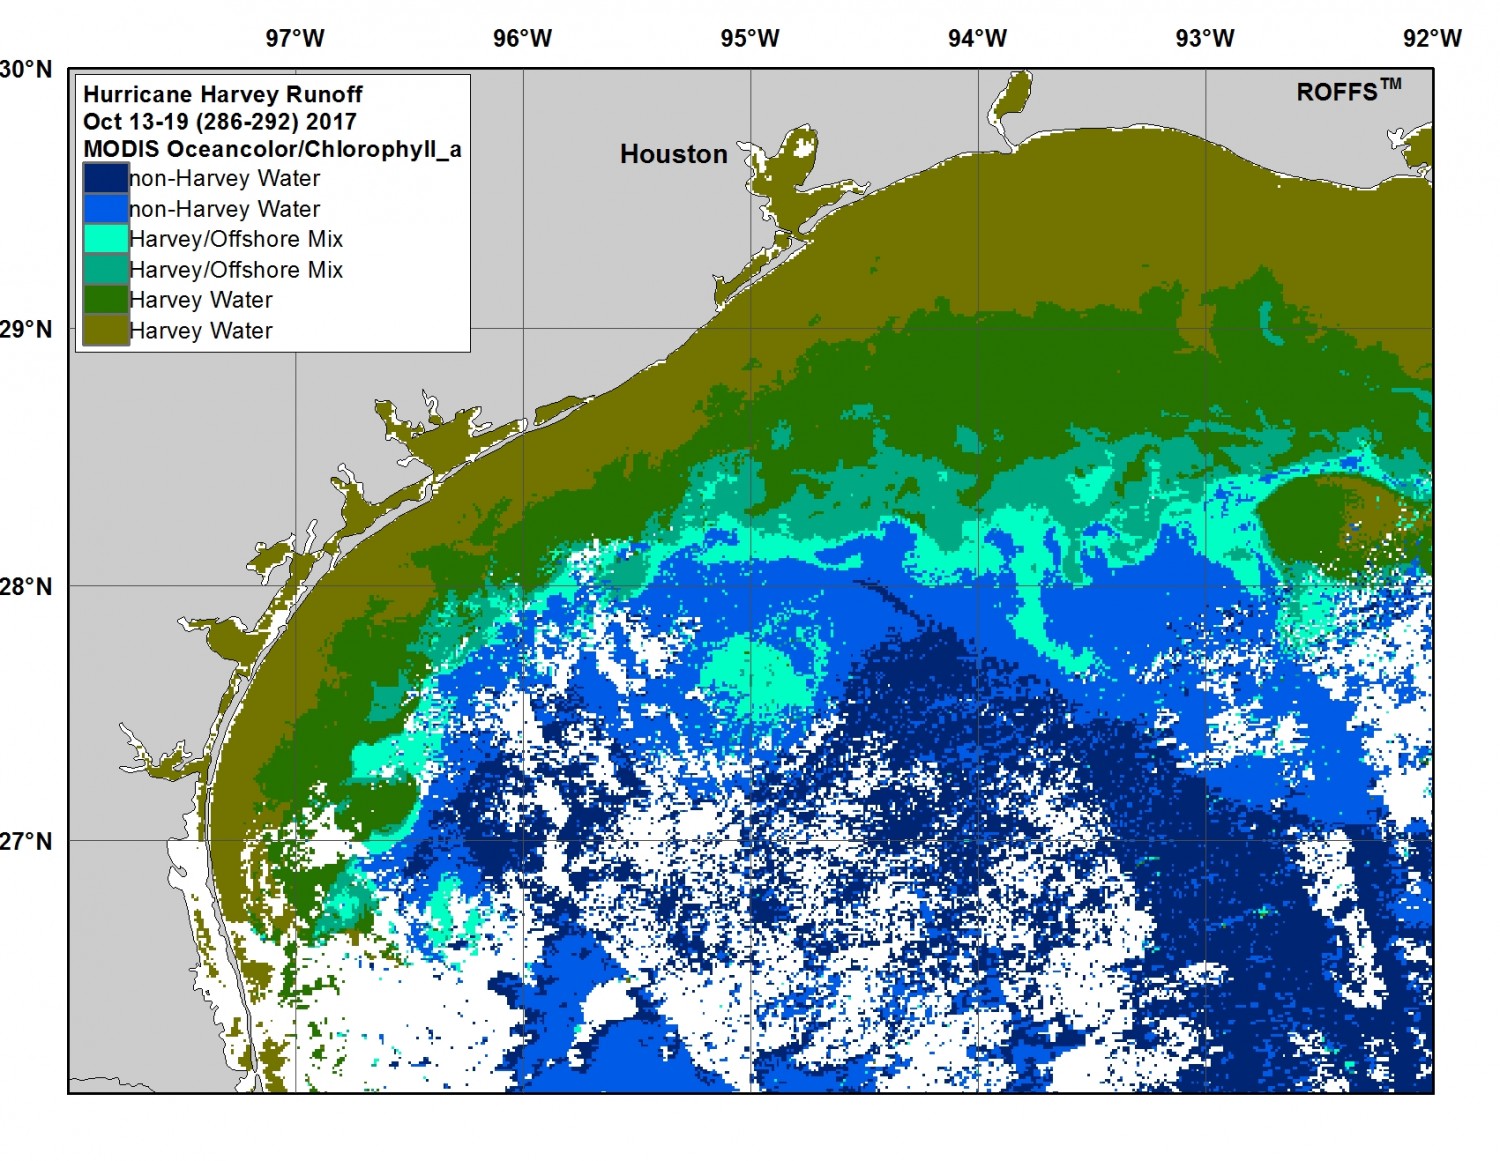
Week 10 (Oct 13-19): This week there was a slight overall decrease in surface area extents of both Harvey water and Harvey/Offshore mixed water. However, there was some cloud cover trouble in the southern AOI. Of note, is the area east of 94°30’W where the drift and expansion of the direct Harvey water and Harvey/Offshore mix continues to move offshore and even deeper than 100 meter depths in some locations, especially offshore of western Louisiana. This is evidence that as the storm hit southern Texas to Houston area first then slowly moved north then northeast that the freshwater Harvey runoff first crested and increased between the Mexico border to Galveston area, and now the area southeast and east of Houston is catching up. Harvey runoff water into the northwest Gulf of Mexico continues to increase and drift offshore east of 94°00’W. There is direct contact of Harvey/Offshore mixed surface water over the Flower Gardens NMS this week.
Image 11 – October 20 – October 26, 2017
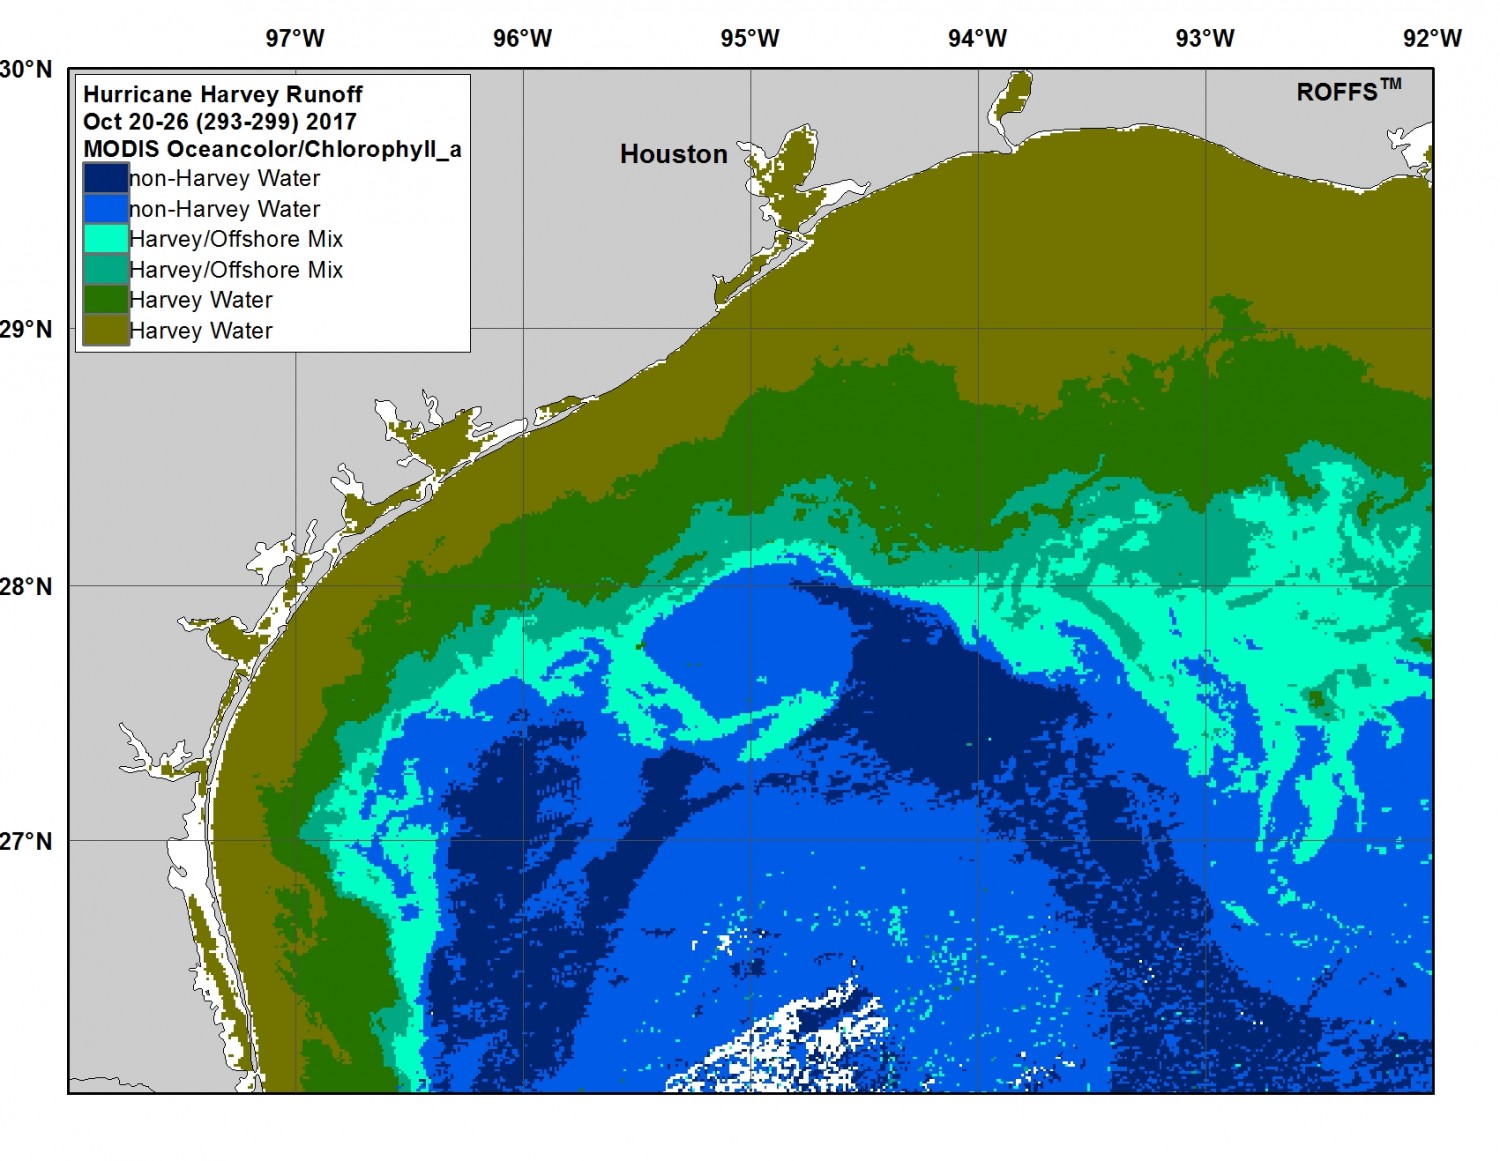
Week 11 (Oct 20-26): There was good satellite coverage and lack of clouds this week for a good overall look. This week marks the new peak surface area extents of both direct Harvey water and Harvey/Offshore mixed water in this AOI. However, looking at the trend from the previous two weeks, this is largely due to the sizable increase of Harvey related water east of 95°00’W while the overall extent west of 95°00’W remains similar to the previous two weeks. This is further evidence of the delay of nearly two weeks between the peak runoff of Harvey water west of 95°00’W and the start of the peak Harvey runoff east of 95°00’W. In the area south of Galveston to south of Louisiana notice the large amount of Harvey/Offshore mixed water pulling offshore and south especially east of 94°00’W. This week there is increased amounts of Harvey/Offshore mixed water directly over the Flower Gardens NMS area.
Image 12 – October 27 – November 2, 2017
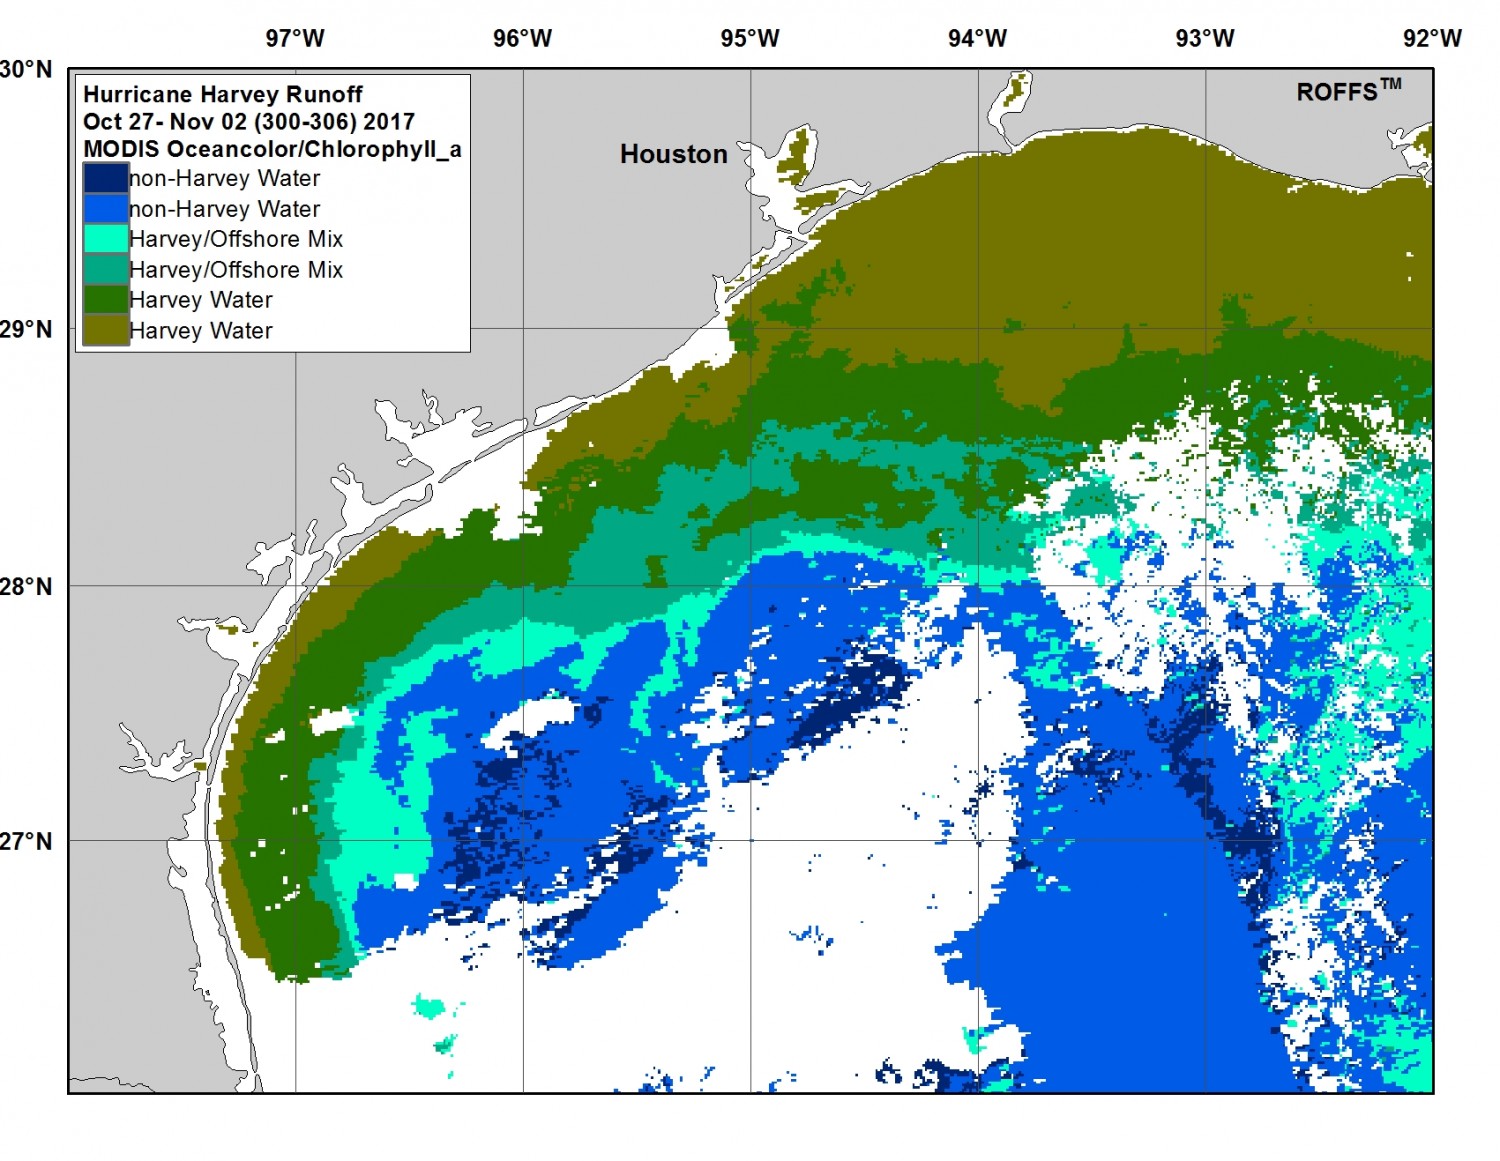
Week 12 (Oct 27 – Nov 2): This week there were problems with a lack of satellite coverage due to clouds. Therefore, the total surface area of Harvey related water decreased. However, looking closer into the overall extent and eyeballing where the Harvey related water is located from the previous two weeks and the following week, one can see the overall extent of Harvey water is similar to the week before in surface water coverage. The Harvey and Harvey/Offshore mixed water continues to remain prevalent east of 95°00’W and moving offshore, while there begins to be evidence that the Harvey related surface area coverage of water is decreasing especially between the Port O’Conner to South Padre Island area. This week suggests there is still some Harvey/Offshore mixed water over the Flower Gardens NMS area.
Image 13 – November 3 – November 9, 2017
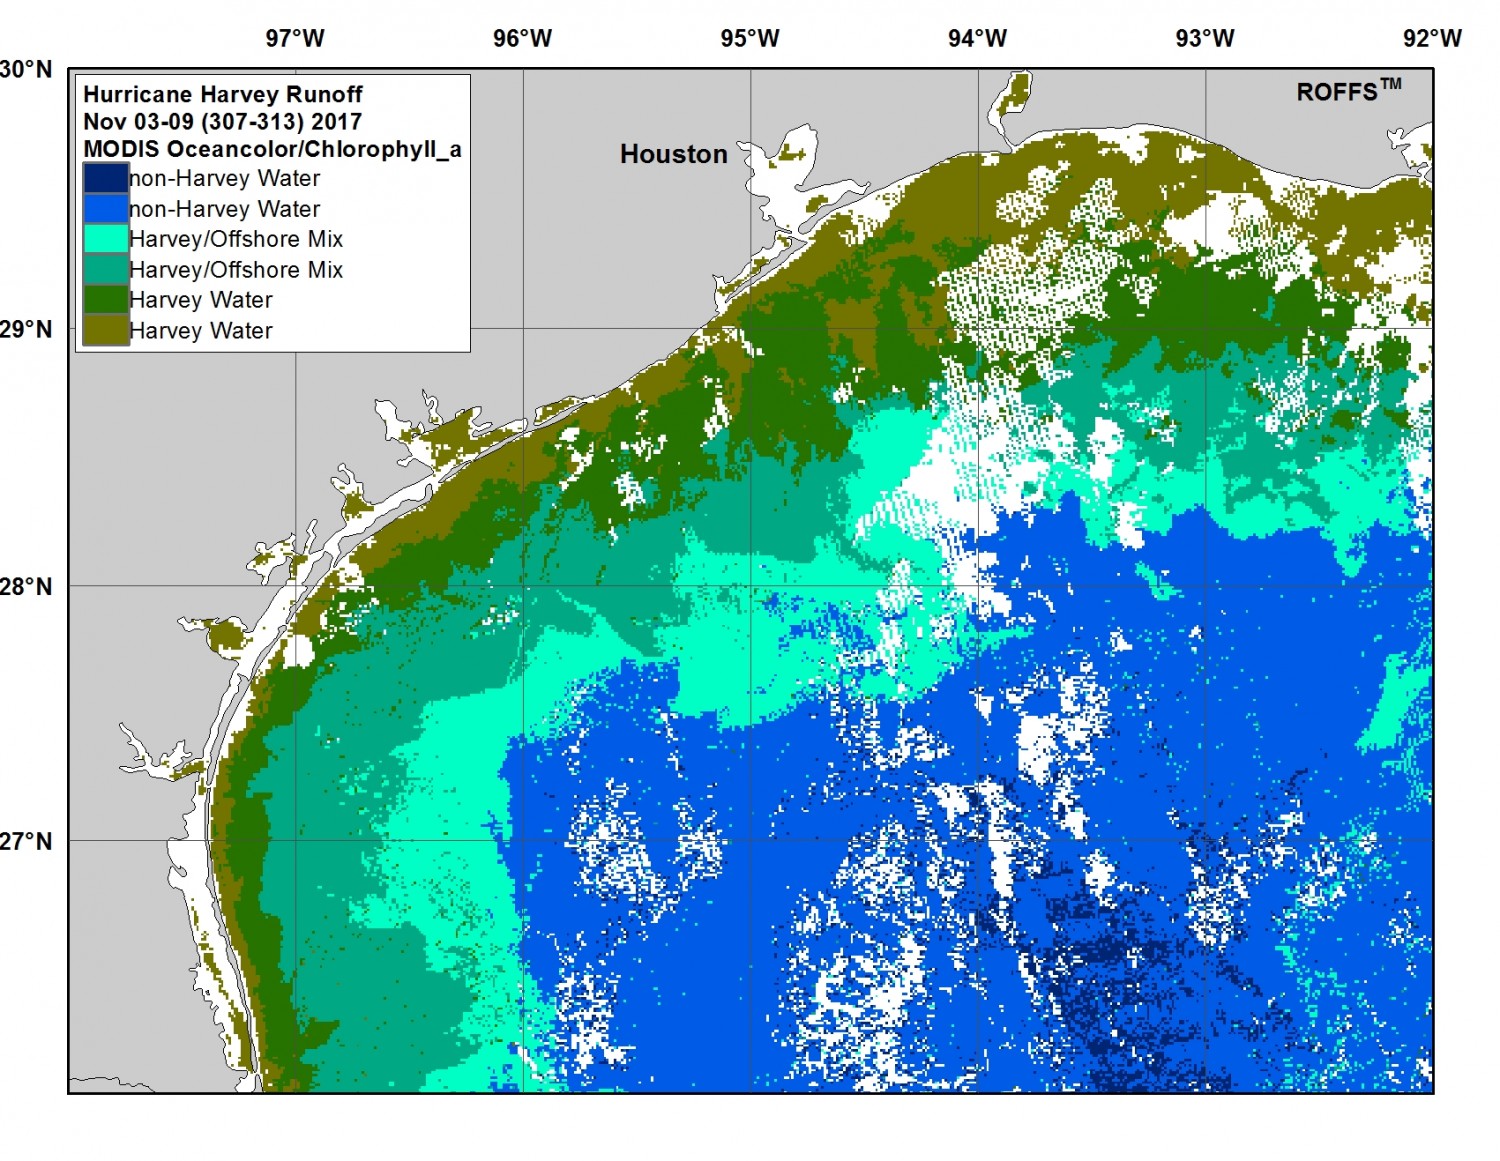
Week 13 (Nov 3 – 9): The overall trend was a decrease in direct Harvey water surface area and a considerable increase in Harvey/Offshore mixed water. However, this may be affected by the trouble with cloud cover and lack of satellite data coverage in the northeastern AOI. Of note is the continual decrease in surface area of direct Harvey water in the area west of 95°00’W and especially west of 96°00’W. There are larger amounts of Harvey/Offshore mixed water in the western AOI this week that may be wind related. There is no evidence of Harvey related water over the Flower Gardens NMS this week.
Image 14 – November 10 – November 16, 2017
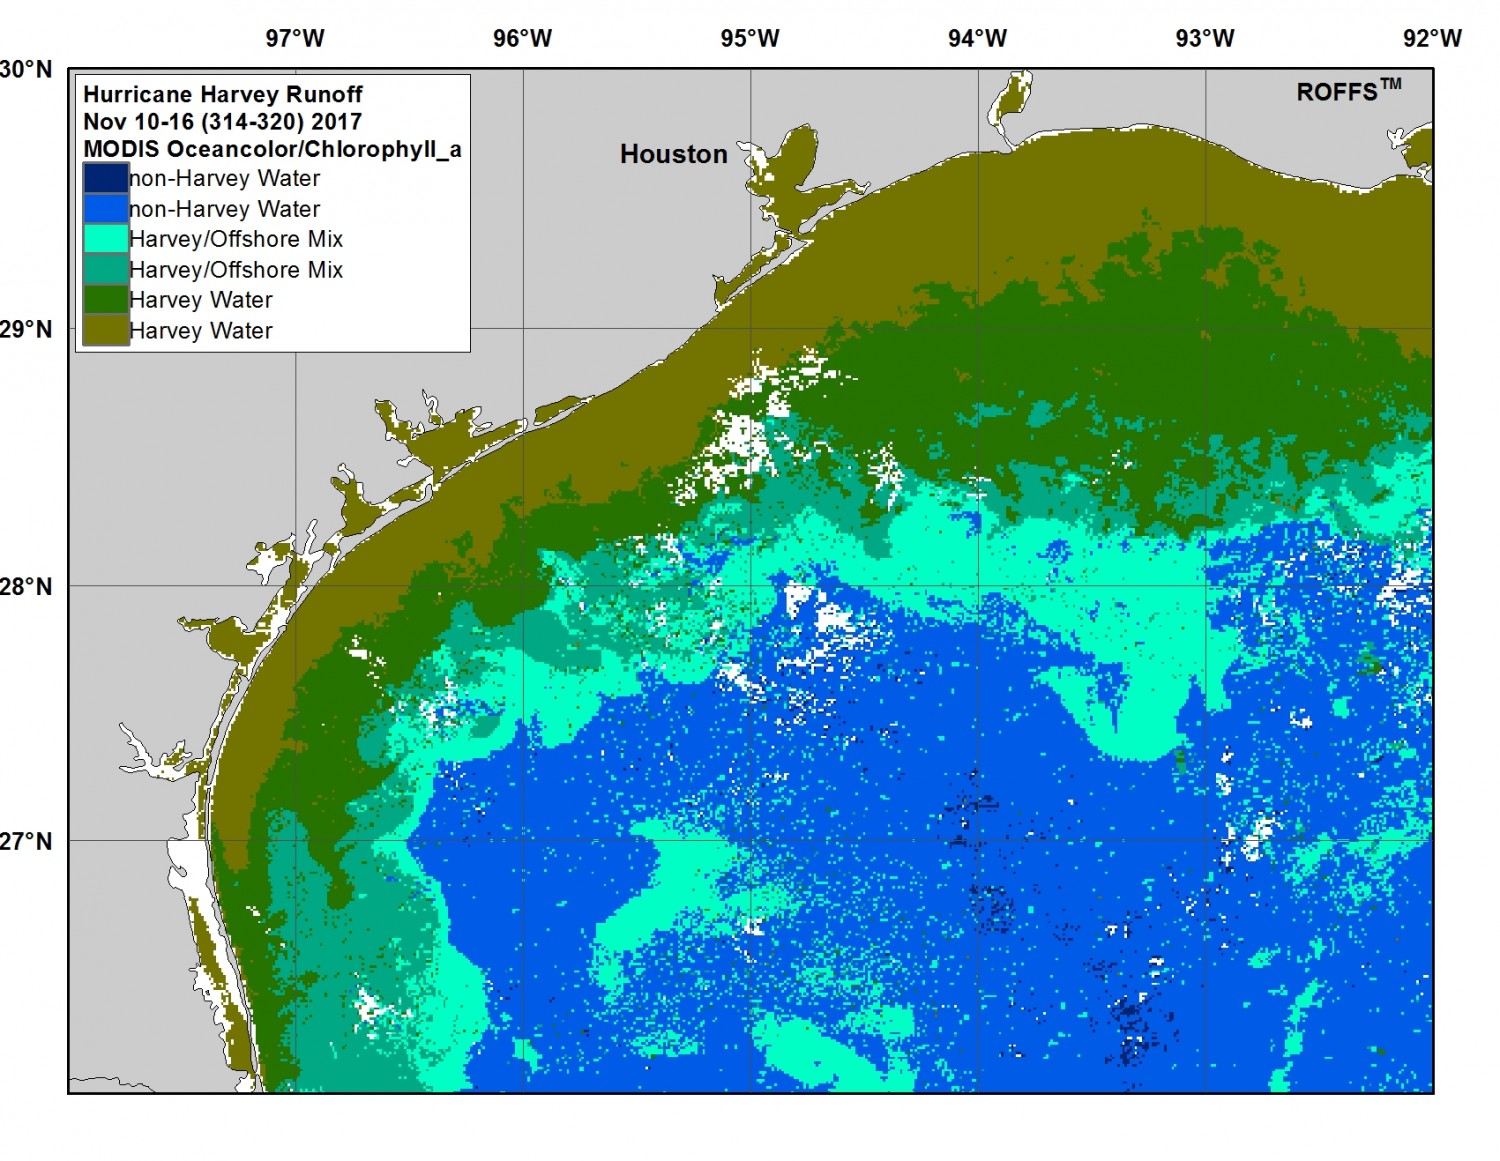
Week 14: (Nov 10 – 16): There was good overall coverage and a lack of clouds and evidence of a considerable increase in direct Harvey water from the week before. This is mainly related to the larger amounts of Harvey water south and east of Galveston area with a slight increase in Harvey water offshore of Corpus Christi to the Port O’ Conner area. There is also larger amounts of Harvey/Offshore mixed water especially pulling south between 92°00’W and 93°00’W including directly over the Flower Gardens NMS area again. Of note there is no direct Harvey water deeper than 100 meters at this time. It is also of note, that the turbid brown water may have been at its peak at the end of October, but the increased amount of greener directly related Harvey water is still increasing overall and dominates the signal of the direct Hurricane water starting toward the beginning to middle of November.
Image 15 – November 17 – November 23, 2017
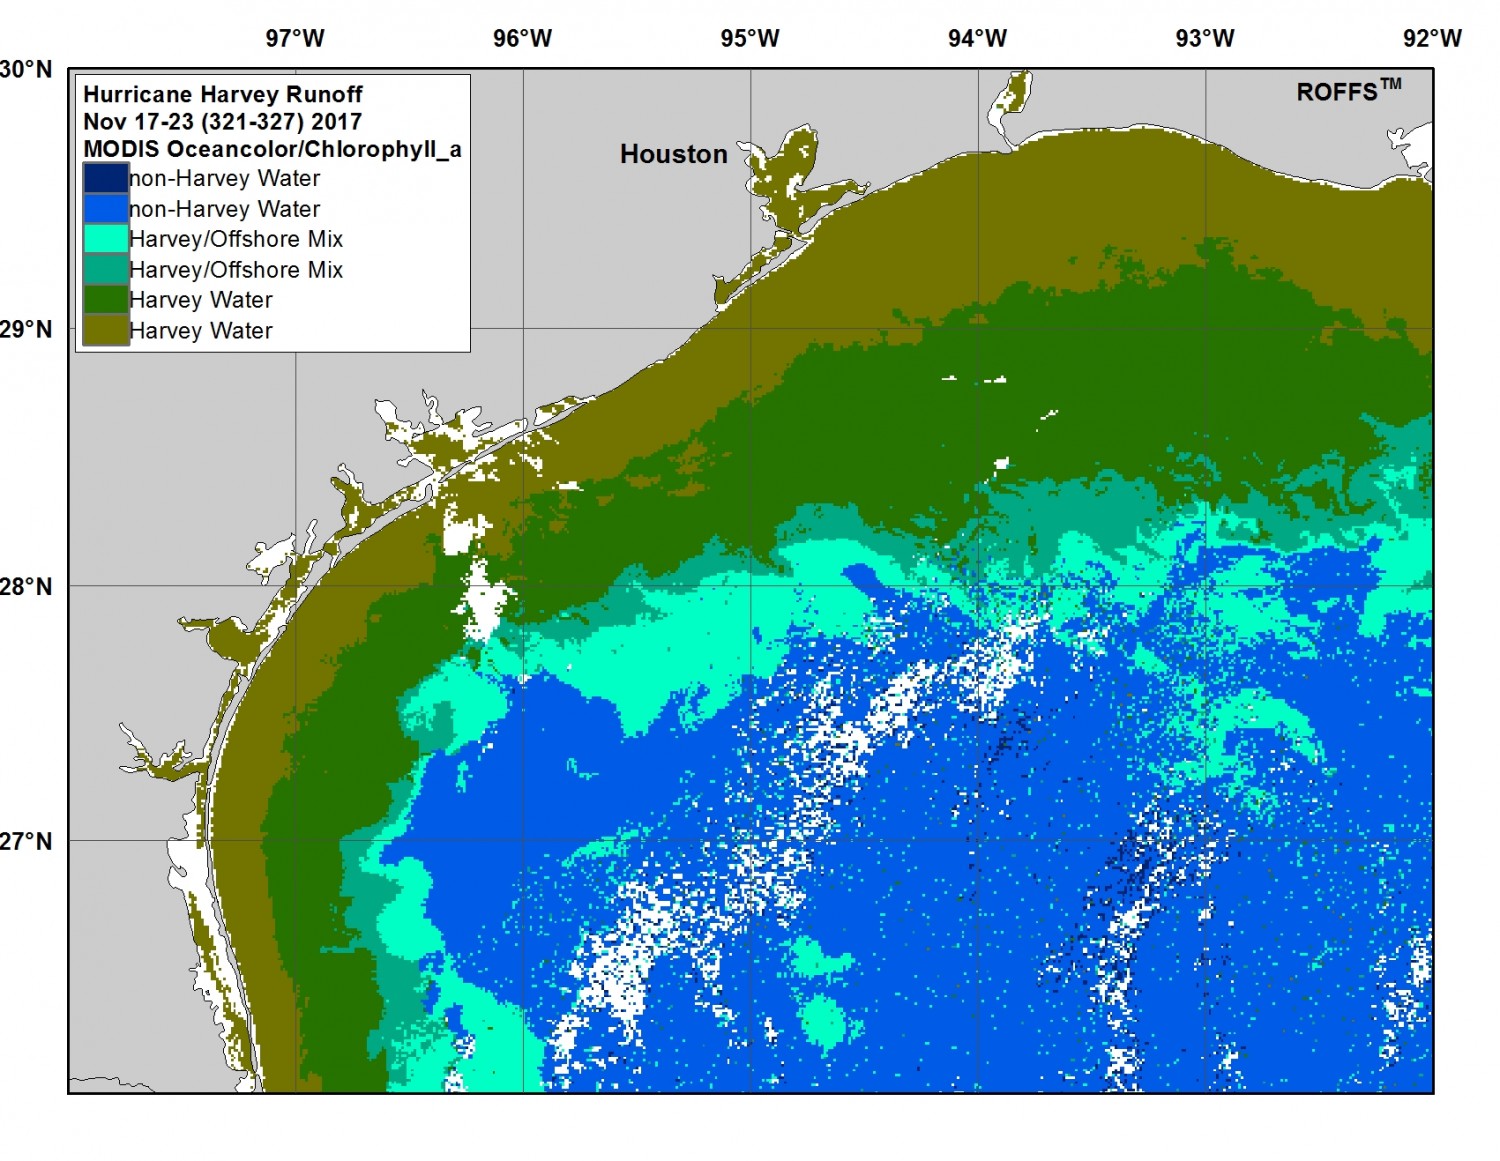
Week 15 (Nov 17-23): Three months after landfall, spatial analysis finds that this week marks the official peak of the extent of surface area of direct Harvey related water from Hurricane Harvey during this 25-week study period. Of note is the dominant signal of green water and direct Harvey water with its largest coverage since the hurricane made landfall specifically east of 96°00’W and the area offshore and east of Port. O’ Conner. However, there was an increase in extent in Harvey water especially the greener water west of 96°00’W along the coast of Texas as well. There is evidence of Harvey/Offshore water mix over the Flower Gardens NMS this week.
Image 16 – November 24 – November 30, 2017
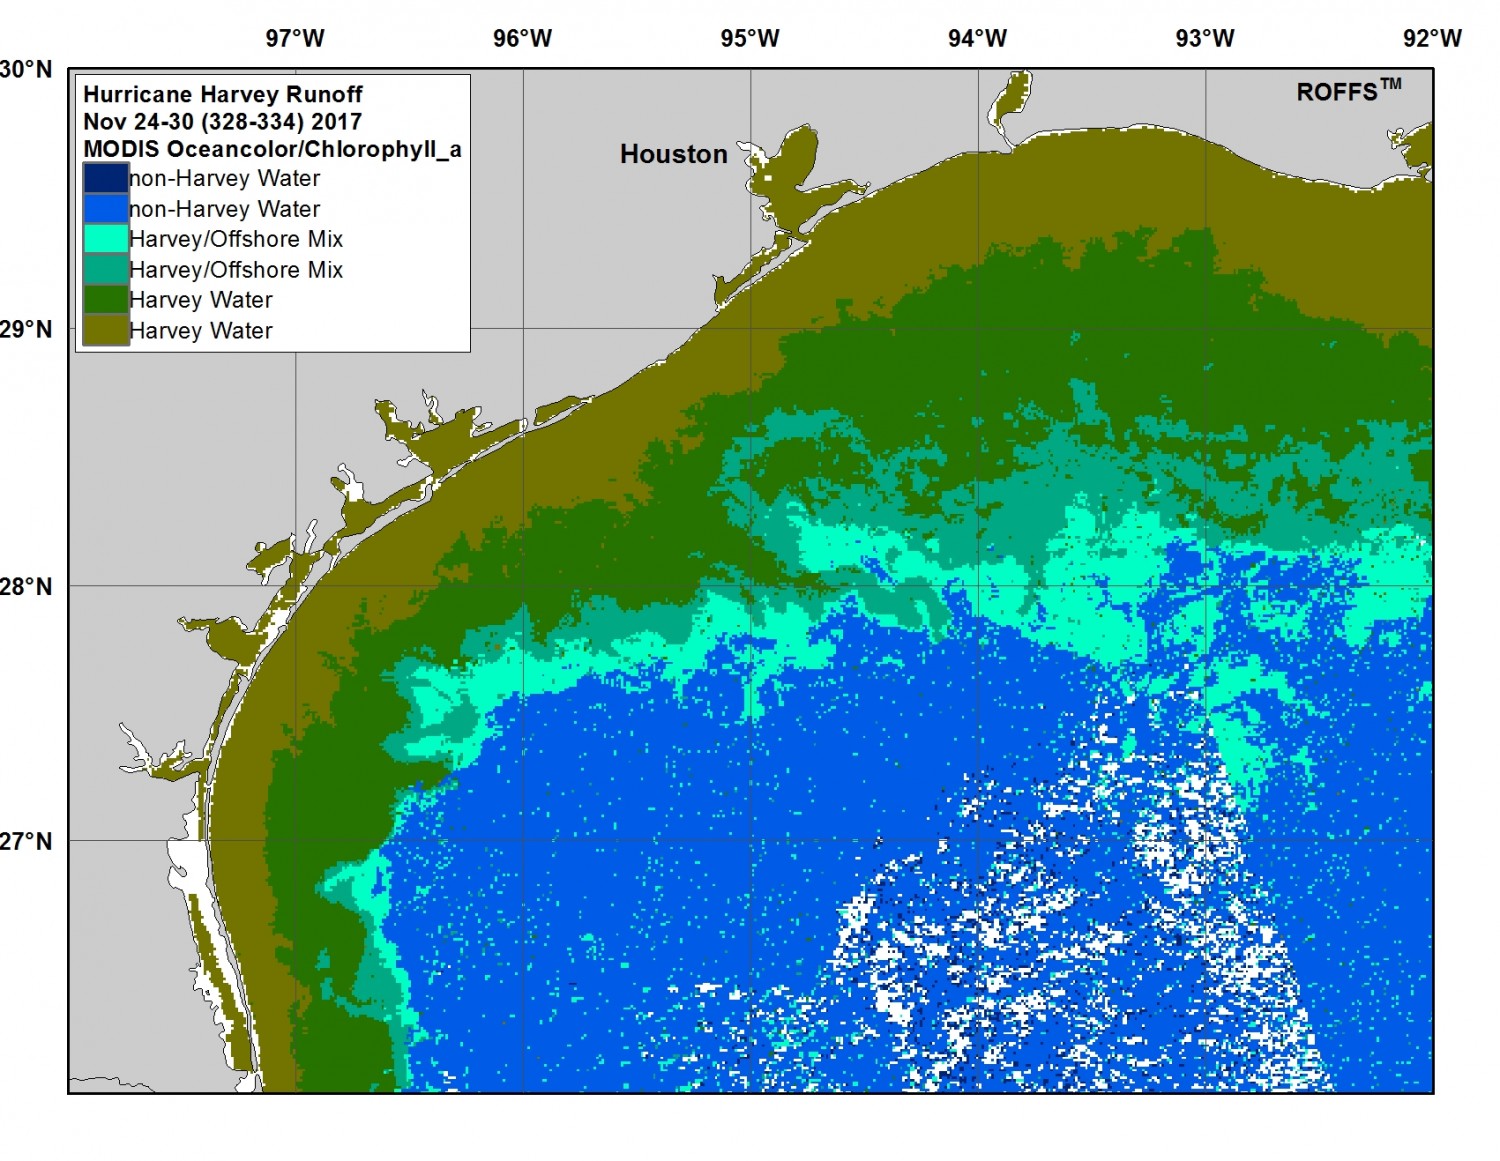
Week 16 (Nov 24-30): This week continues the two-week peak of the surface area coverage of direct Harvey water in this AOI. It continues to show that three months after Hurricane Harvey made landfall, the effects and runoff of the freshwater flow and expansion into and within the Gulf of Mexico are still evident and effecting the life cycle of many species and water quality over large areas in the Northwest Gulf of Mexico. It is of note that the pattern looks very similar to the previous week with the majority of the water flow appearing to be to the east and southeast especially east of 95°30’W. There is a push of Harvey water offshore and further southeast of Port Aransas into areas deeper than 100 meters. There is also continued evidence of Harvey/Offshore mixed water over the Flower Gardens NMS area.
Image 17 – December 1 – December 7, 2017
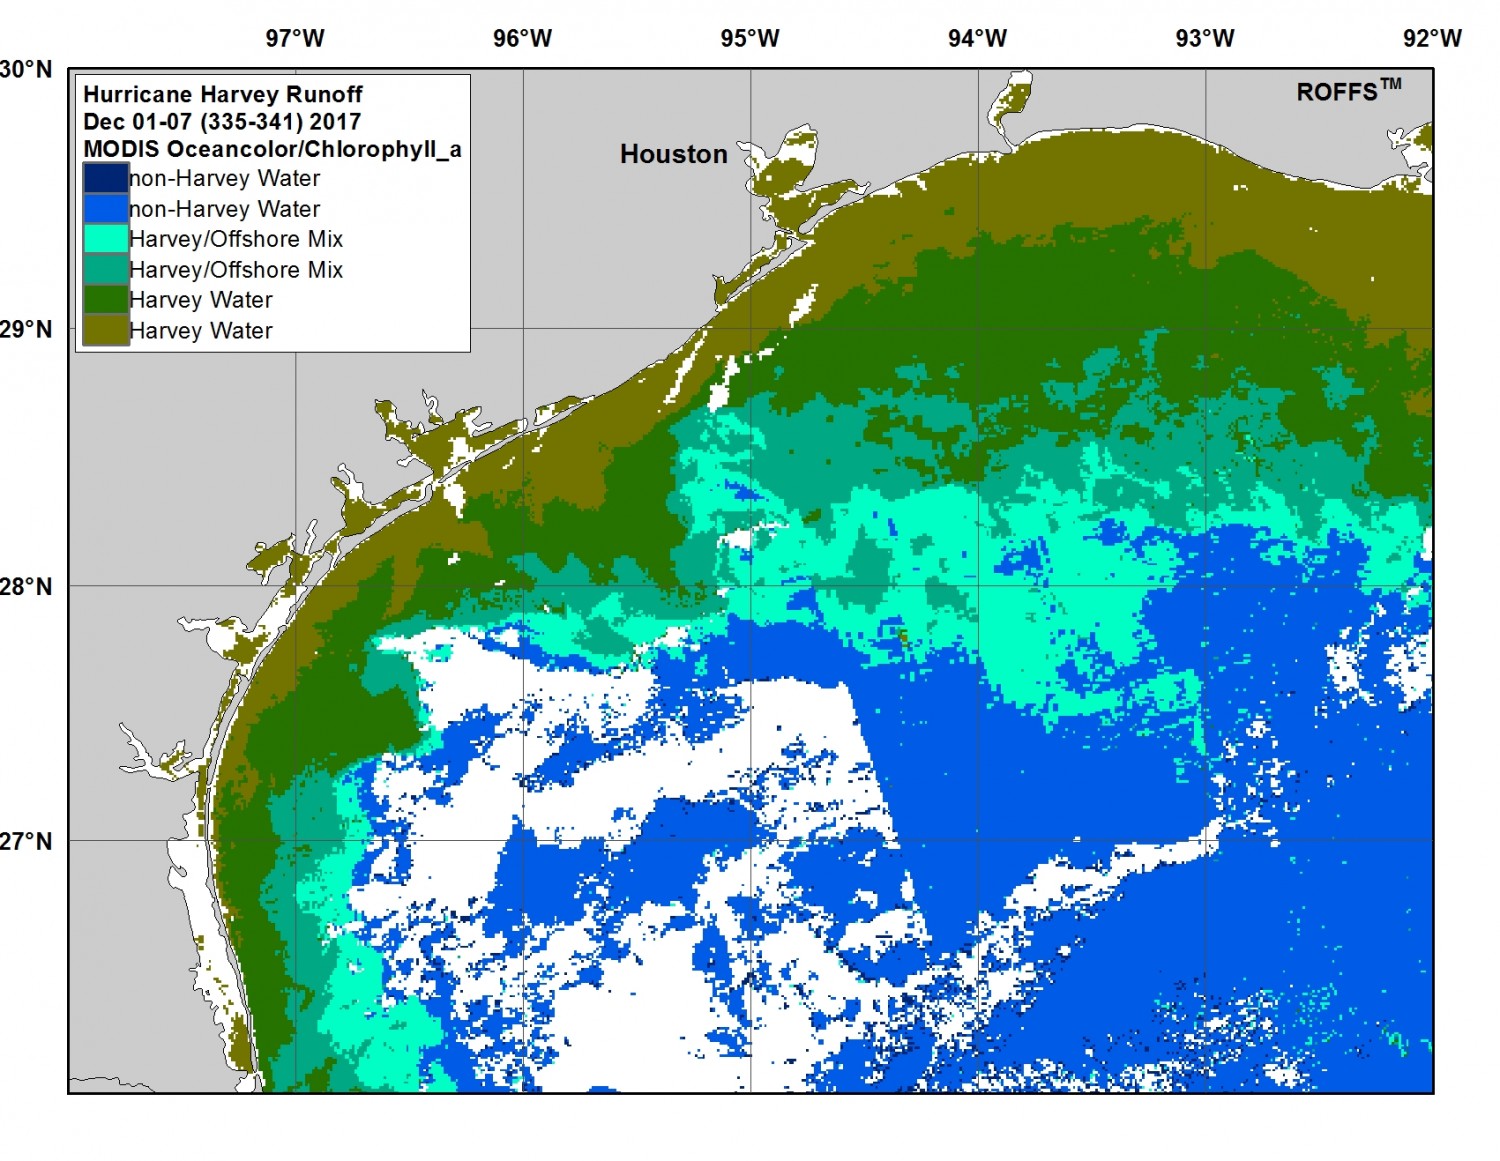
Week 17 (Dec 1-7): Although cloud cover was an issue with satellite coverage in the western AOI, ROFFS™ continues to notice the trend of near peak Harvey water and Harvey/Offshore mixed water especially in the area east of 96°00’W and continued flow and expansion of the Harvey/Offshore mixed water south and offshore between 95°00’W and 93°00’W including directly over the Flower Gardens NMS area.
Image 18 – December 8 – December 14, 2017
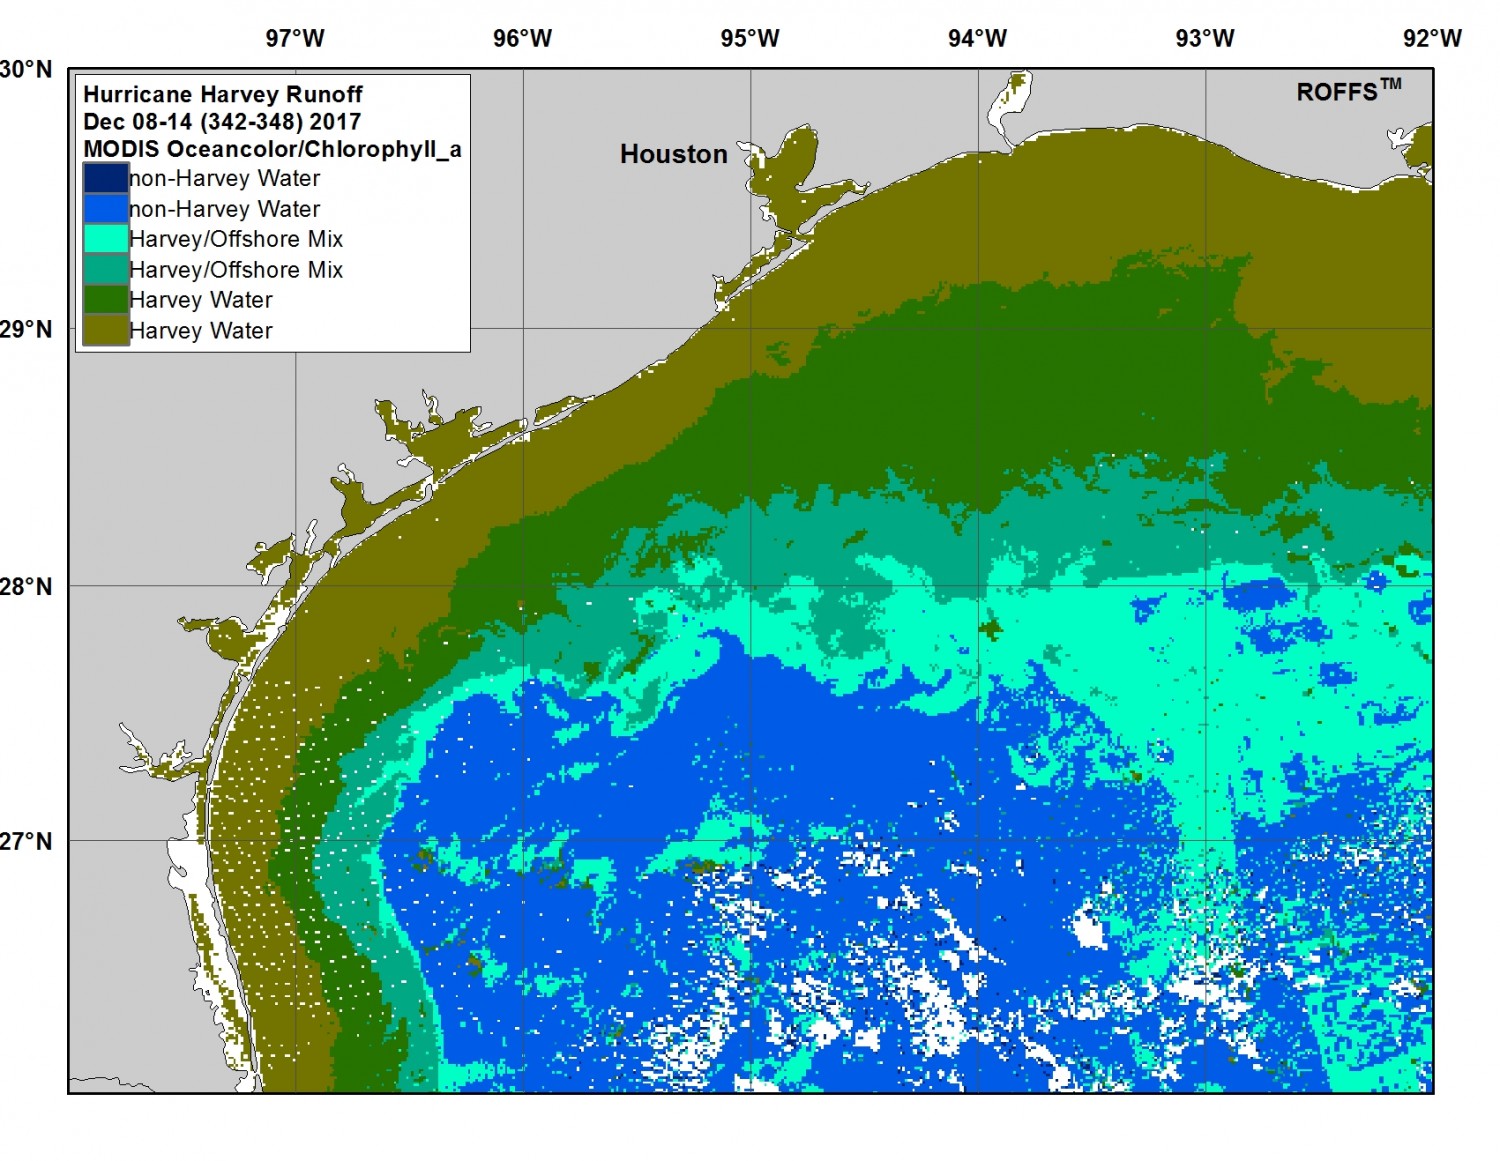
Week 18 (Dec 8-14): This was another good coverage week and represents the end of the four-to-five-week peak of Harvey water surface area in this AOI; in fact it is the second highest surface area of direct Harvey water during this 25-week study. Of note is the larger amount of green Harvey water in the east and especially the southern expansion of Harvey/Offshore mixed water farther south than it has ever been and well offshore of the 100 meter contour and directly over the Flower Gardens NMS. There is likely a larger offshore eddy centered somewhere near 93°50’W & 27°10’N pulling this water south and offshore. Also of note is the larger extent of green and turbid brown Harvey water extending south of western Louisiana during this week. Overall, this marks the end of the peak period of Harvey water extents after Harvey made landfall nearly four months ago. It is of note that the peak temporal range of the Harvey related water and surface area west of 95°00’W was in the late October to beginning of November period, while the peak of the surface area of Harvey related water east of 95°00’W Galveston/Houston and east was mid-to-late November and into the beginning of December.
Image 19 – December 15 – December 21, 2017
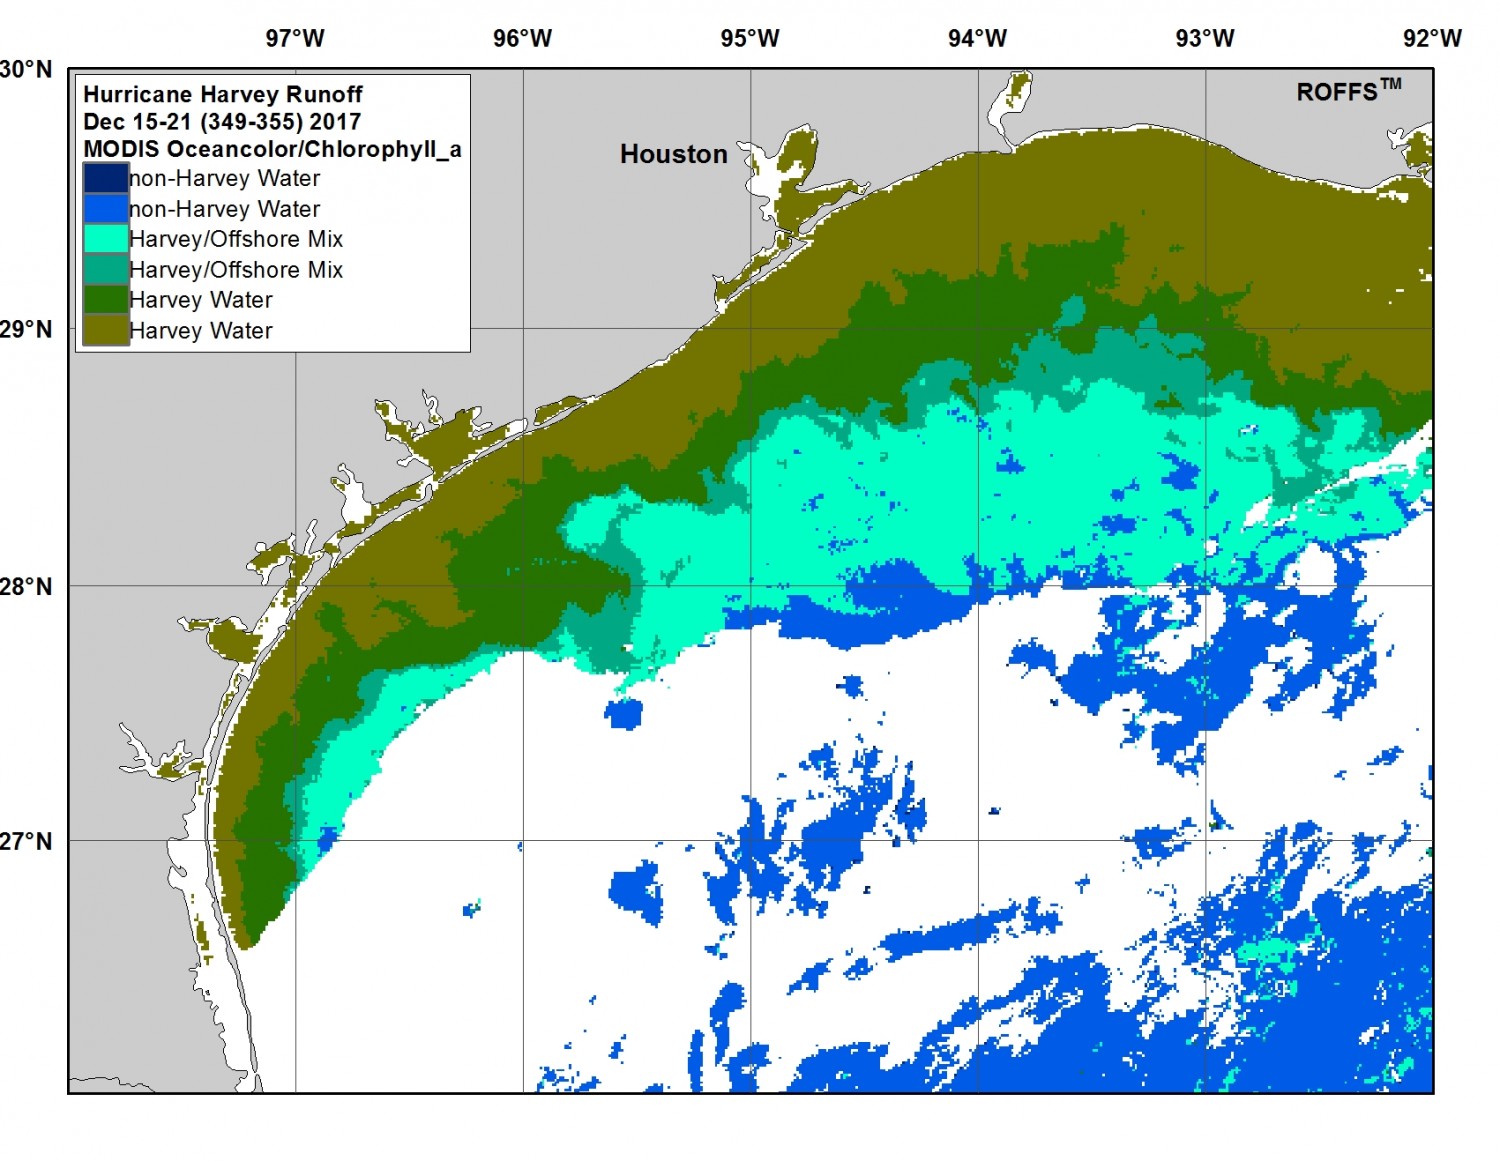
Week 19 (Dec 15-21): After mid-December it is worth mentioning that there was lots of cloud cover in most weeks and it was difficult to get a good read of the trend and follow the Hurricane Harvey related water accurately. So keep in mind to look at the overall extents related to the previous weeks in November and early December to pick out the overall extents and coverage. This week starts the period of time throughout the remainder of the weeks of this project that the overall direct Harvey water starts a noticeable decline in surface area. This signifies the start of a return to normal conditions and evidence that the direct Harvey water is starting to mix out within the water columns and starting to reduce the effects of pollution from the Harvey freshwater runoff plumes. This week most of the cloud cover was offshore and in the south, so one notices the decline in surface area of Harvey water and the decrease of Harvey/Offshore mix. There is no overlap of Harvey related water in the Flower Gardens NMS area.
Image 20 – December 22 – December 28, 2017
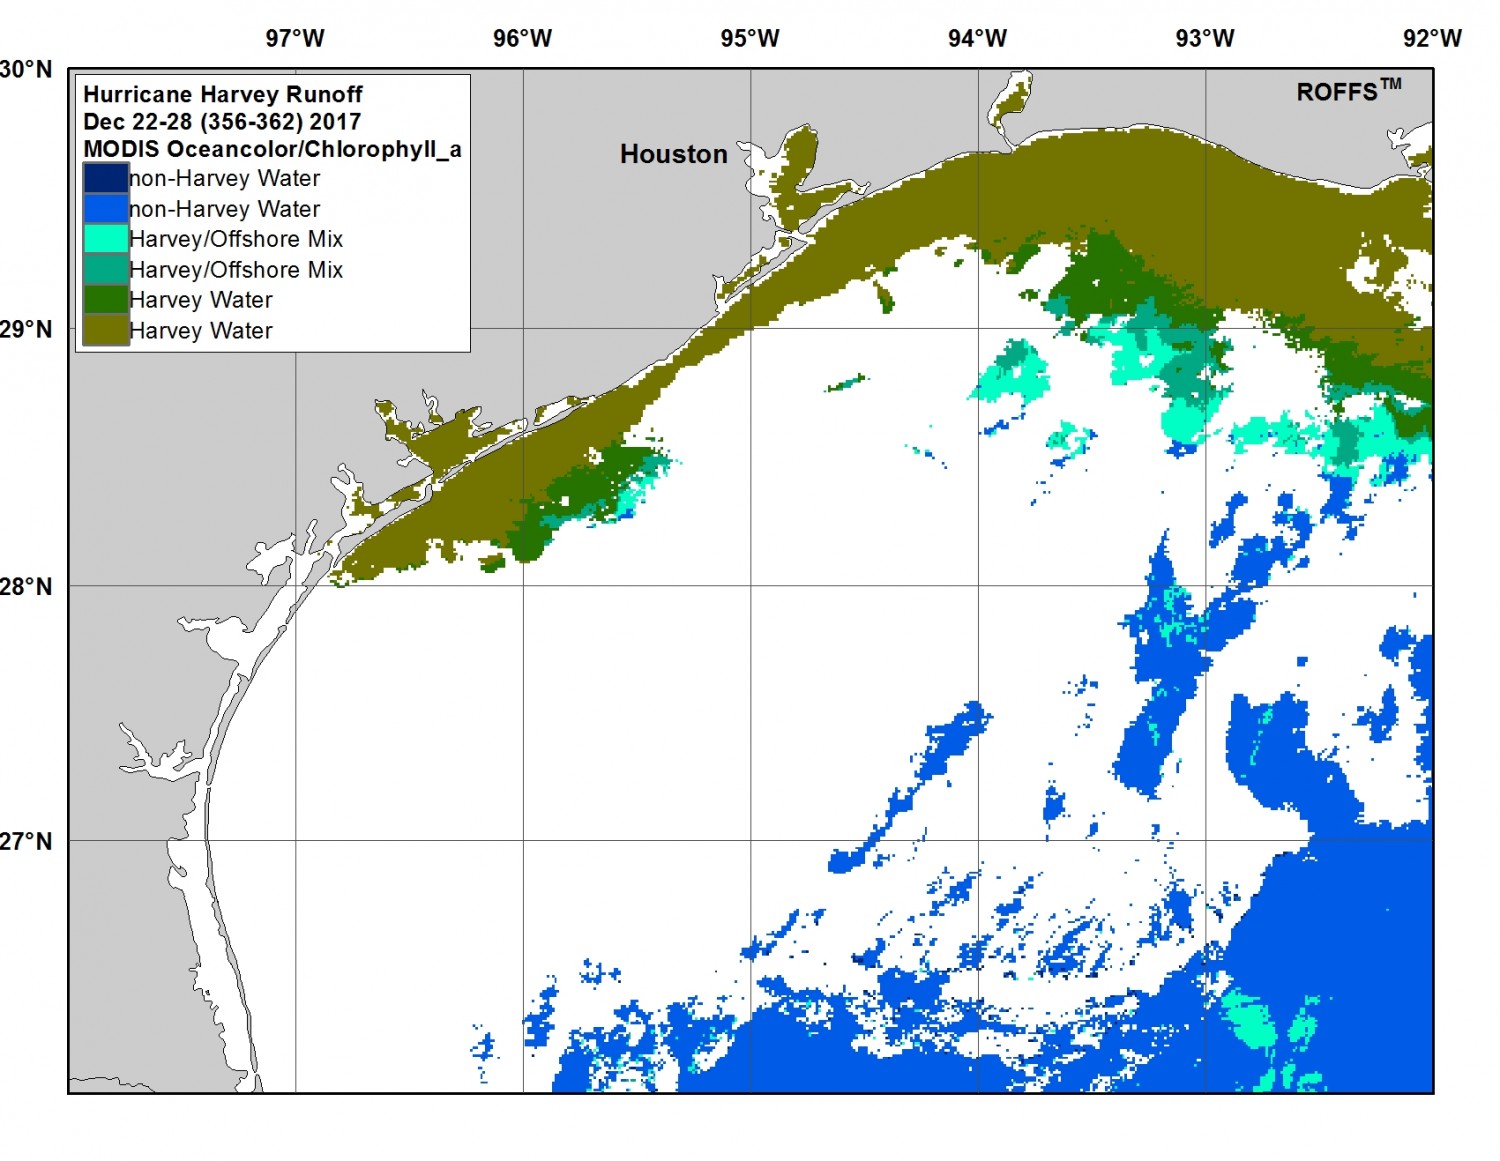
Week 20 (Dec 22-28): There was significant cloud cover this week, making it difficult to identify the Harvey water and how far it decreased or increased. However, when compared to the previous weeks, it does appear that the direct Harvey water remained similar to the reduced coverage from the week before, particularly offshore of Port O’ Conner and east. Furthermore the trend of the greener water and the Harvey/Offshore mixed water also appears to be similar and perhaps even decreased overall in its extent offshore compared to the previous two weeks. It is unknown but unlikely there is any Harvey related water this week over the Flower Gardens NMS area.
Image 21 – December 29, 2017 – January 4, 2018
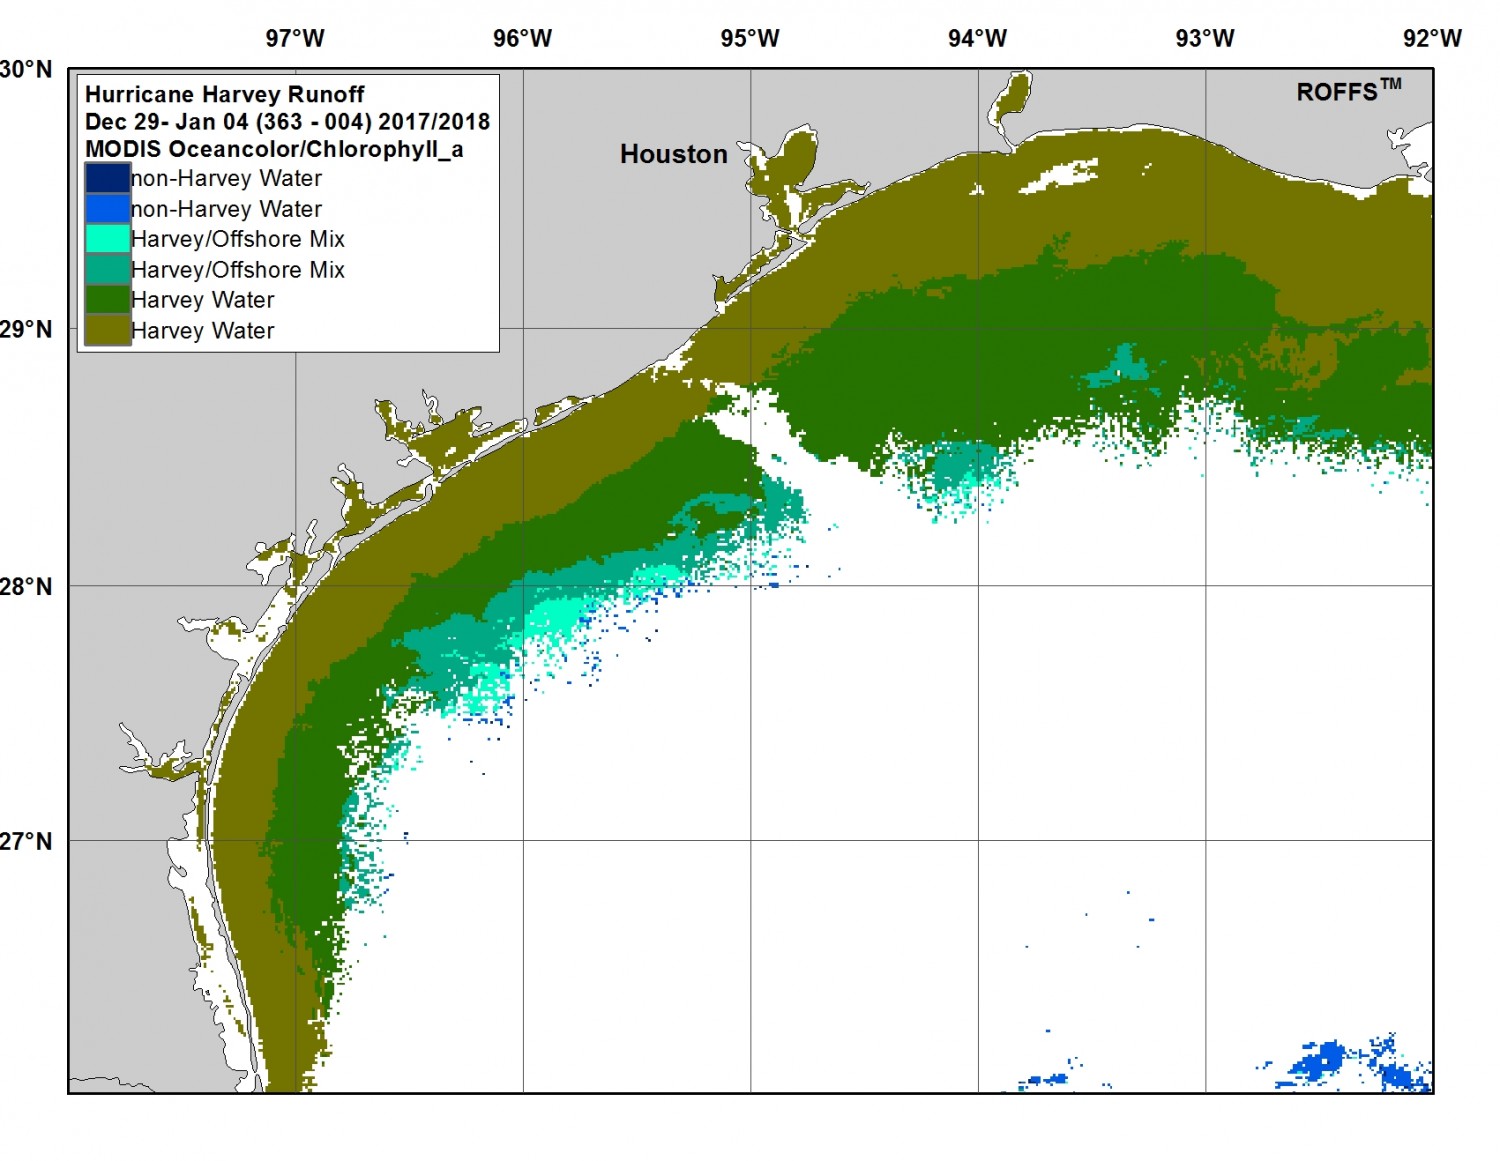
Week 21 (Dec 29 – Jan 4): There was significant cloud cover but mainly offshore. Therefore, notice the amounts of direct Hurricane Harvey related water inshore that still appears to extend 40-60 miles offshore of Texas and western Louisiana through most of this charted area especially east of 95°00’W. The amount of Harvey water increased from the previous two weeks, but was similar to the extent two to three weeks ago but still a decline overall from the peak weeks. It is unknown what the coverage of Harvey/Offshore mixed water is offshore this week, but it is speculated that there it little to no contact with the Flower Gardens NMS area.
Image 22 – January 5 – January 11, 2018
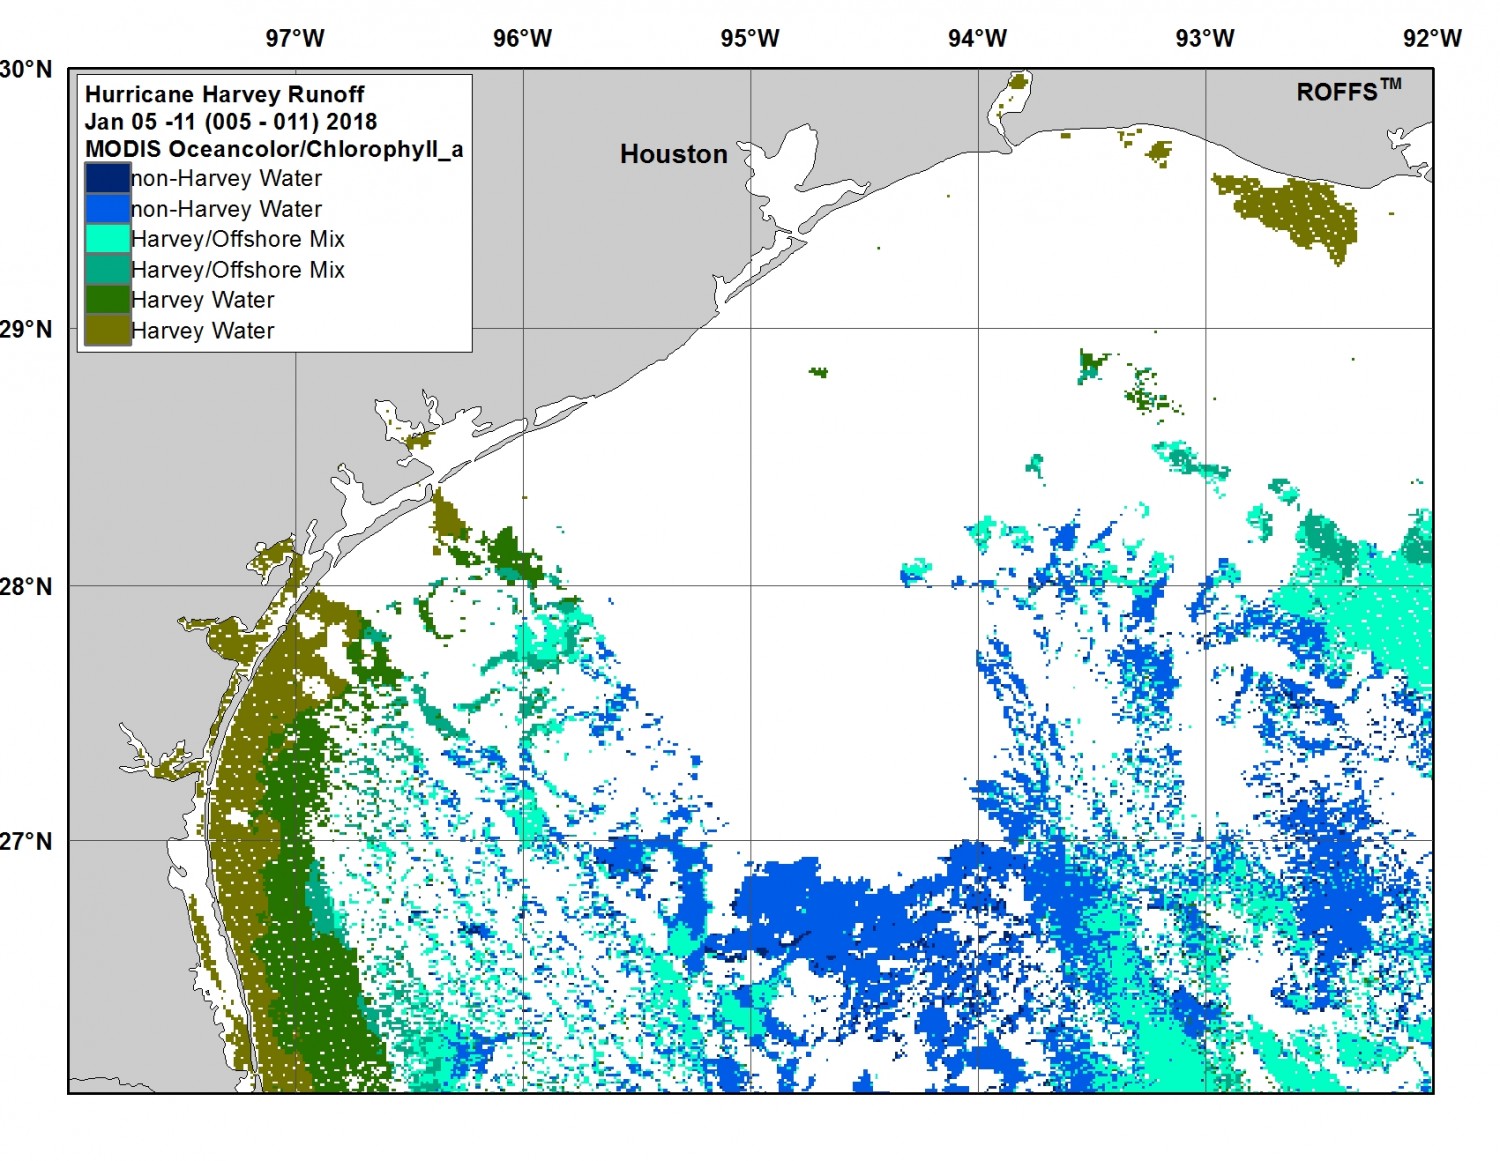
Week 22 (Jan 5-11): Moving into the first full week of January 2018 and into the fifth month of monitoring the Hurricane Harvey water there is a significant amount of cloud cover obstructing satellite coverage this week. The only area viewable of the extent of possible Harvey related water was east and south of Port Aransas/Corpus Christi area. Notice that the direct Harvey water continues to extend about 20 miles offshore of Texas with the Harvey/Offshore mixed water appearing to extend another 30-40 miles offshore in this western AOI. In the east, one can only possibly conclude that the mixed Harvey/Offshore water appears to still extend quite a bit south into the 100 meter depths and south of 28°00’N and east of 93°00’W. There is a possible interaction with Harvey/Offshore mixed water in the Flower Gardens NMS area.
Image 23 – January 12 – January 18, 2018
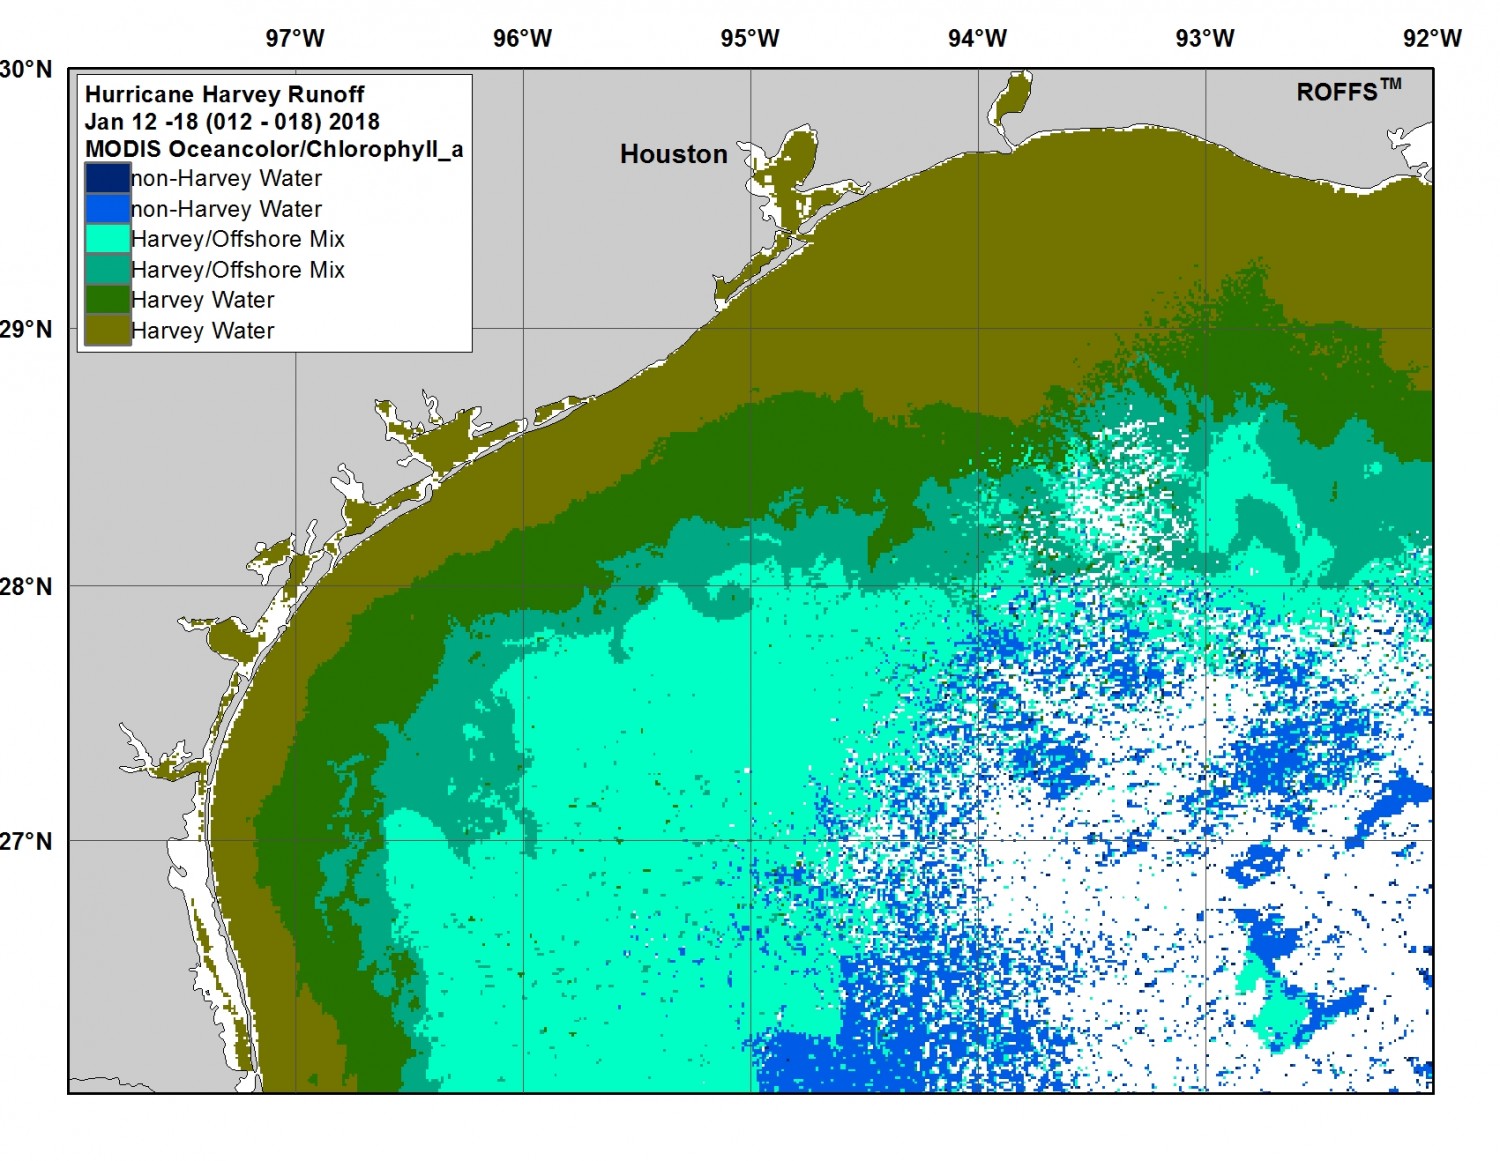
Week 23 (Jan 12-18): This was the best coverage and overall clear view of the water in this area in about a month. Notice the large amounts of Harvey/Offshore mixed water especially the blue/green water well offshore of 100-meter depths especially in the west. This week it appears that the Harvey/Offshore mixed water overlaps the Flower Gardens NMS area. Of note is the normal looking distribution of direct Harvey green and turbid brown water in the west, but the increase of this direct Harvey water, especially the turbid brown water southeast of Galveston and south of Port Arthur. Since this is the first clear week in about a month, it raises the question that perhaps the Harvey water could still be near peak or just less than peak extent coverage. Or this week could be related to a wind mixing episode or winter algae bloom that was non-related to Hurricane Harvey water and considered an anomaly.
Image 24 – January 19 – January 25, 2018
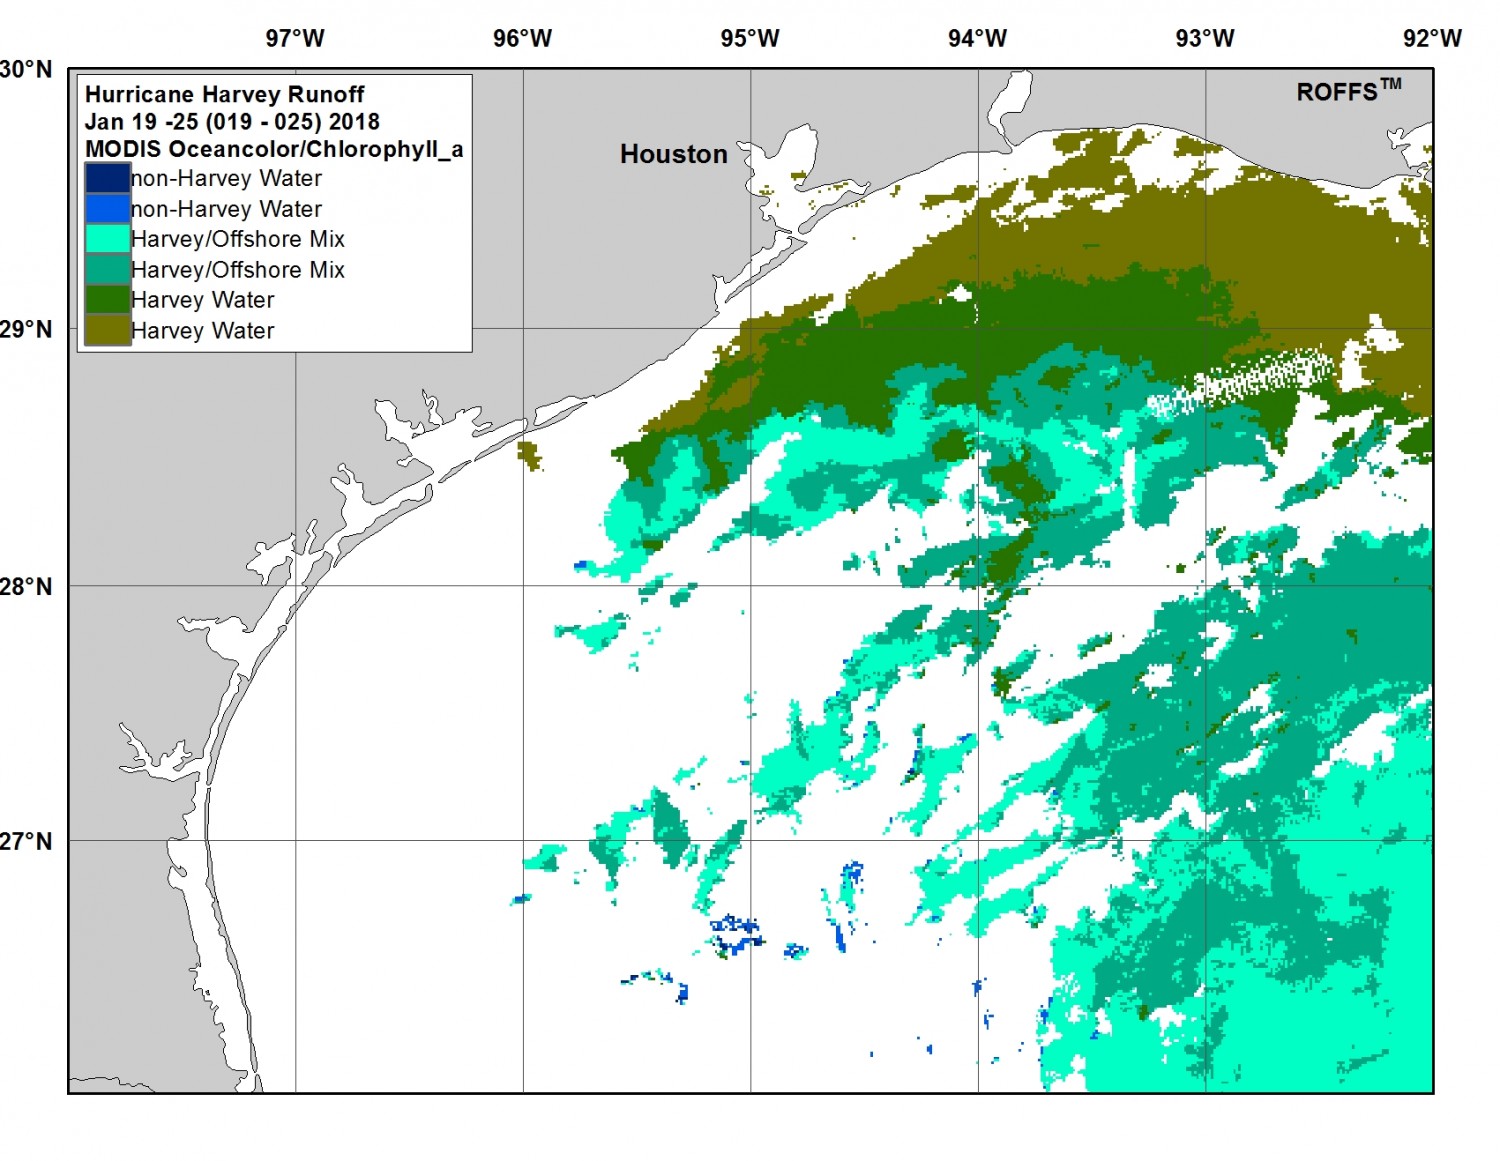
Week 24 (Jan 19-25): This week was again effected by lack of satellite coverage due to cloud cover, particularly in the west AOI. Also, there was trouble with calibration and artifacts and it appears that there may be some false green/blue and blue/green Harvey/Offshore mixed water further offshore in the eastern-charted area. However, it is quite possible due to the trend 4-6 weeks ago that the Harvey/Offshore mixed water may indeed have extended and moved farther south and if that is the case it is indeed back over the Flower Gardens NMS area as a higher concentration of Harvey related water. This week remains inconclusive on the overall extent of Harvey related water due to the lack of data.
Image 25 – January 26 – February 1, 2018
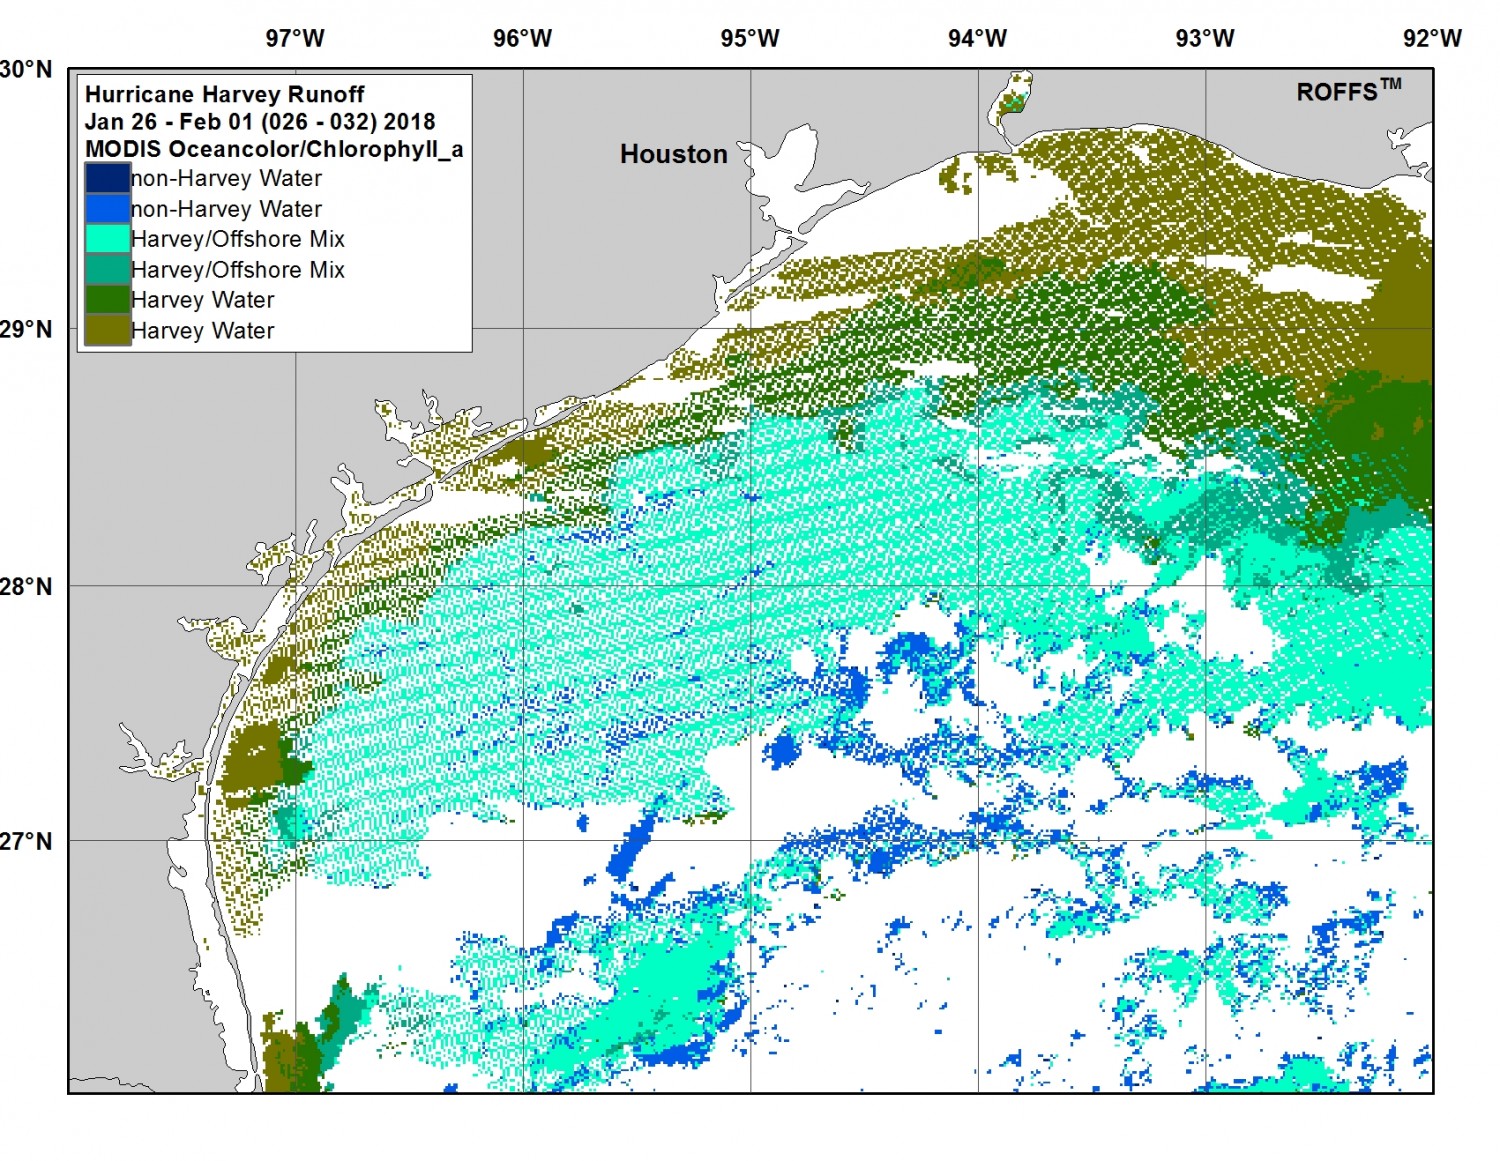
Week 25 (Jan 26 – Feb 1): This last week of Hurricane Harvey water observation also had a lack of satellite coverage and trouble with calibration due to the lack of data and cloud cover. However, of note is that the overall trend does look similar to the previous two weeks with a large amount of Harvey/Offshore mixed water extending well offshore of the 100-meter depths and over the Flower Gardens NMS. Overall, it continues to appear the direct Harvey water is decreasing in the west and remains similar and slightly decreasing in the east compared to the past two weeks and from early to mid-December. However, due to the lack of coverage and clouds, there is a chance that there is some false blue/green and green/blue water offshore. It does appear that the direct Harvey water continues to be prevalent south of western Louisiana. There is an overall decrease in directly related Harvey water since the beginning to mid-December.
* It is of note that ROFFS™ continued to monitor the water during the remainder of the winter and into spring in the Northwest Gulf of Mexico. By late spring, early summer (May/June), any sort of signal of direct Harvey water has all but dissipated and the extents of these water categories appeared to return to normal. In fact, there were larger amounts of bluer water relatively far inshore by late spring and early summer and this abundance of bluer water trend remained throughout most of the summer.
[/et_pb_text][/et_pb_column][/et_pb_row][/et_pb_section]